1ENVIRONMENTAL PRODUCT DECLARATION PERMABASE® CEMENT BOARD PRODUCTS
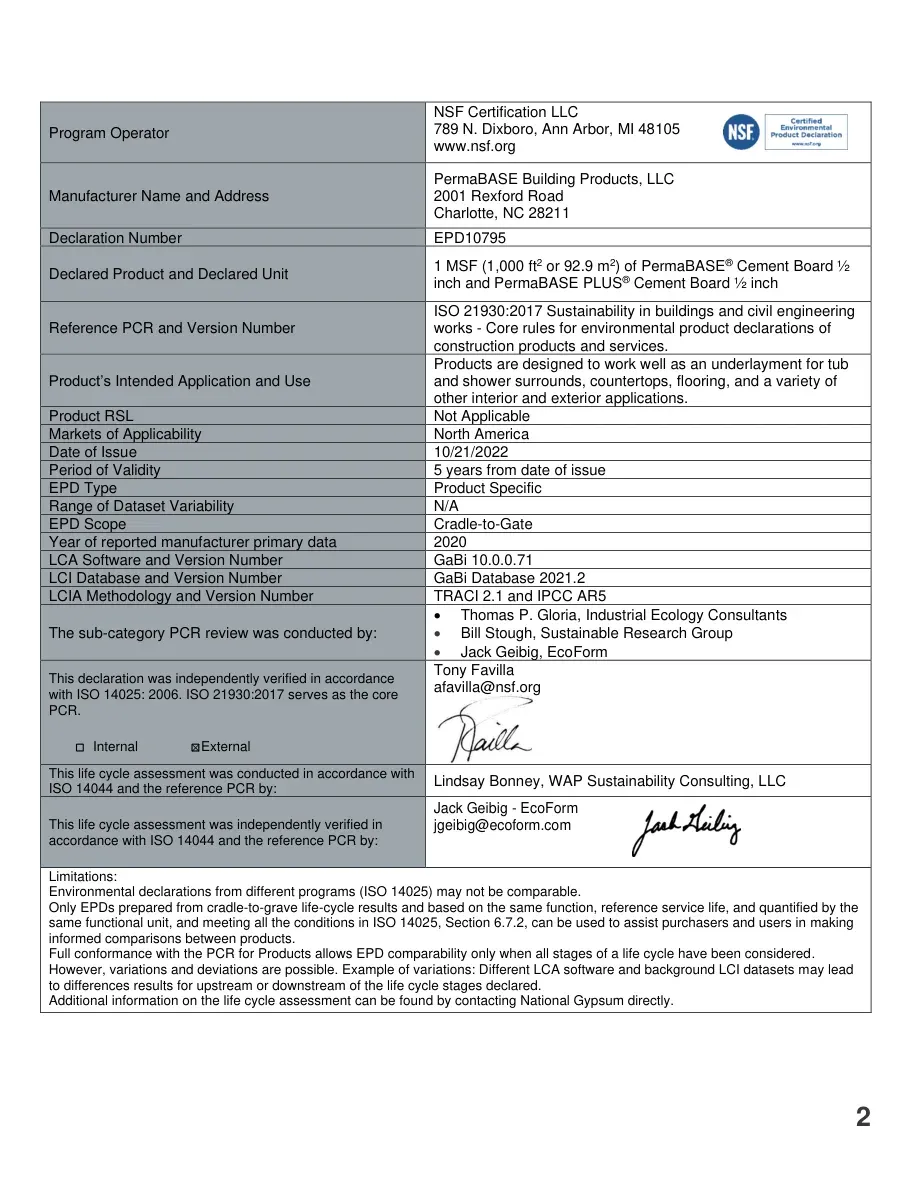
2 Program Operator NSF Certification LLC 789 N. Dixboro, Ann Arbor, MI 48105 www.nsf.org Manufacturer Name and Address PermaBASE Building Products, LLC 2001 Rexford Road Charlotte, NC 28211 Declaration Number EPD10795 Declared Product and Declared Unit 1 MSF (1,000 ft2 or 92.9 m2) of PermaBASE® Cement Board ½ inch and PermaBASE PLUS® Cement Board ½ inch Reference PCR and Version Number ISO 21930:2017 Sustainability in buildings and civil engineering works - Core rules for environmental product declarations of construction products and services. Product’s Intended Application and Use Products are designed to work well as an underlayment for tub and shower surrounds, countertops, flooring, and a variety of other interior and exterior applications. Product RSL Not Applicable Markets of Applicability North America Date of Issue 10/21/2022 Period of Validity 5 years from date of issue EPD Type Product Specific Range of Dataset Variability N/A EPD Scope Cradle-to-Gate Year of reported manufacturer primary data 2020 LCA Software and Version Number GaBi 10.0.0.71 LCI Database and Version Number GaBi Database 2021.2 LCIA Methodology and Version Number TRACI 2.1 and IPCC AR5 The sub-category PCR review was conducted by: • Thomas P. Gloria, Industrial Ecology Consultants • Bill Stough, Sustainable Research Group • Jack Geibig, EcoForm This declaration was independently verified in accordance with ISO 14025: 2006. ISO 21930:2017 serves as the core PCR. Internal External Tony Favilla afavilla@nsf.org This life cycle assessment was conducted in accordance with ISO 14044 and the reference PCR by: Lindsay Bonney, WAP Sustainability Consulting, LLC This life cycle assessment was independently verified in accordance with ISO 14044 and the reference PCR by: Jack Geibig - EcoForm jgeibig@ecoform.com Limitations: Environmental declarations from different programs (ISO 14025) may not be comparable. Only EPDs prepared from cradle-to-grave life-cycle results and based on the same function, reference service life, and quantified by the same functional unit, and meeting all the conditions in ISO 14025, Section 6.7.2, can be used to assist purchasers and users in making informed comparisons between products. Full conformance with the PCR for Products allows EPD comparability only when all stages of a life cycle have been considered. However, variations and deviations are possible. Example of variations: Different LCA software and background LCI datasets may lead to differences results for upstream or downstream of the life cycle stages declared. Additional information on the life cycle assessment can be found by contacting National Gypsum directly.
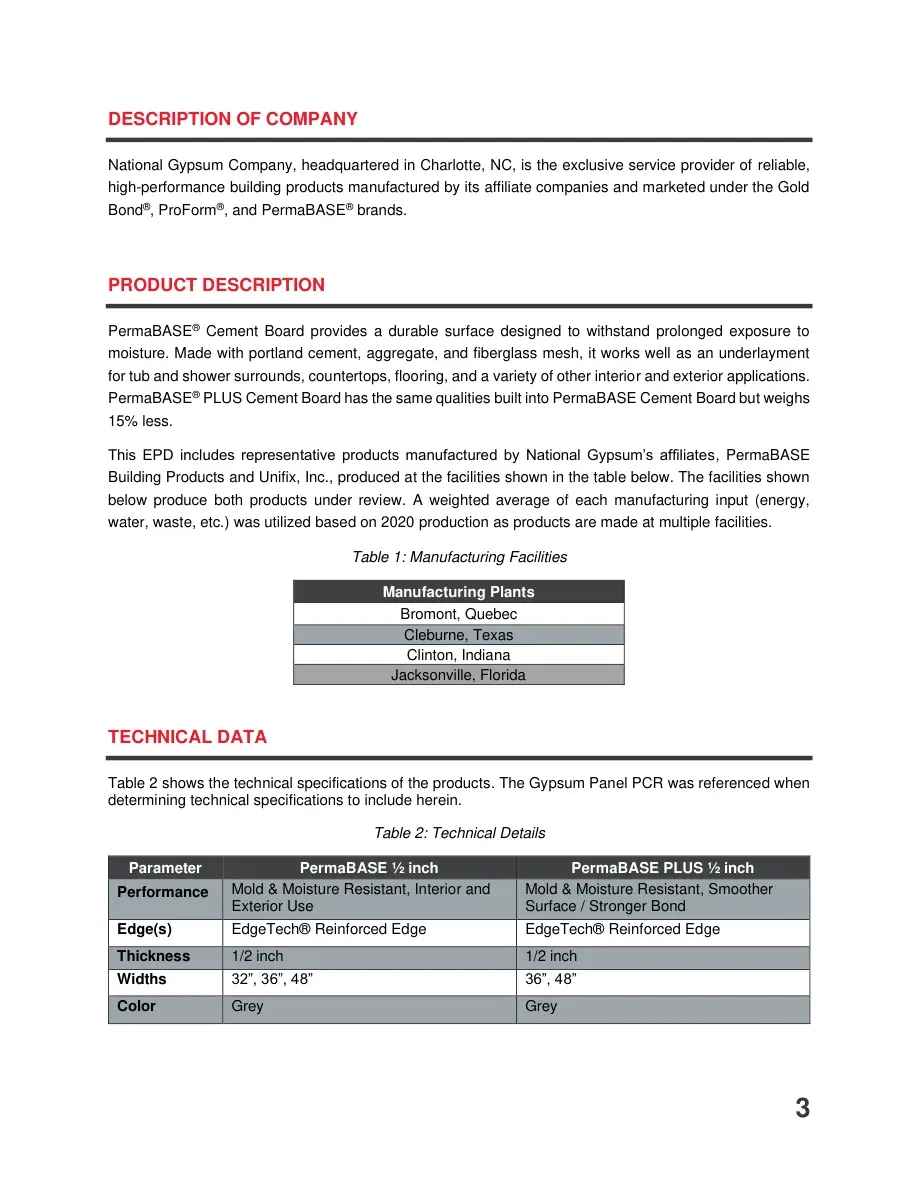
3DESCRIPTION OF COMPANY National Gypsum Company, headquartered in Charlotte, NC, is the exclusive service provider of reliable, high-performance building products manufactured by its affiliate companies and marketed under the Gold Bond®, ProForm®, and PermaBASE® brands. PRODUCT DESCRIPTION PermaBASE® Cement Board provides a durable surface designed to withstand prolonged exposure to moisture. Made with portland cement, aggregate, and fiberglass mesh, it works well as an underlayment for tub and shower surrounds, countertops, flooring, and a variety of other interior and exterior applications. PermaBASE® PLUS Cement Board has the same qualities built into PermaBASE Cement Board but weighs 15% less. This EPD includes representative products manufactured by National Gypsum’s affiliates, PermaBASE Building Products and Unifix, Inc., produced at the facilities shown in the table below. The facilities shown below produce both products under review. A weighted average of each manufacturing input (energy, water, waste, etc.) was utilized based on 2020 production as products are made at multiple facilities. Table 1: Manufacturing Facilities Manufacturing Plants Bromont, Quebec Cleburne, Texas Clinton, Indiana Jacksonville, Florida TECHNICAL DATA Table 2 shows the technical specifications of the products. The Gypsum Panel PCR was referenced when determining technical specifications to include herein. Table 2: Technical Details Parameter PermaBASE ½ inch PermaBASE PLUS ½ inch Performance Mold & Moisture Resistant, Interior and Exterior Use Mold & Moisture Resistant, Smoother Surface / Stronger Bond Edge(s) EdgeTech® Reinforced Edge EdgeTech® Reinforced Edge Thickness 1/2 inch 1/2 inch Widths 32”, 36”, 48” 36”, 48” Color Grey Grey
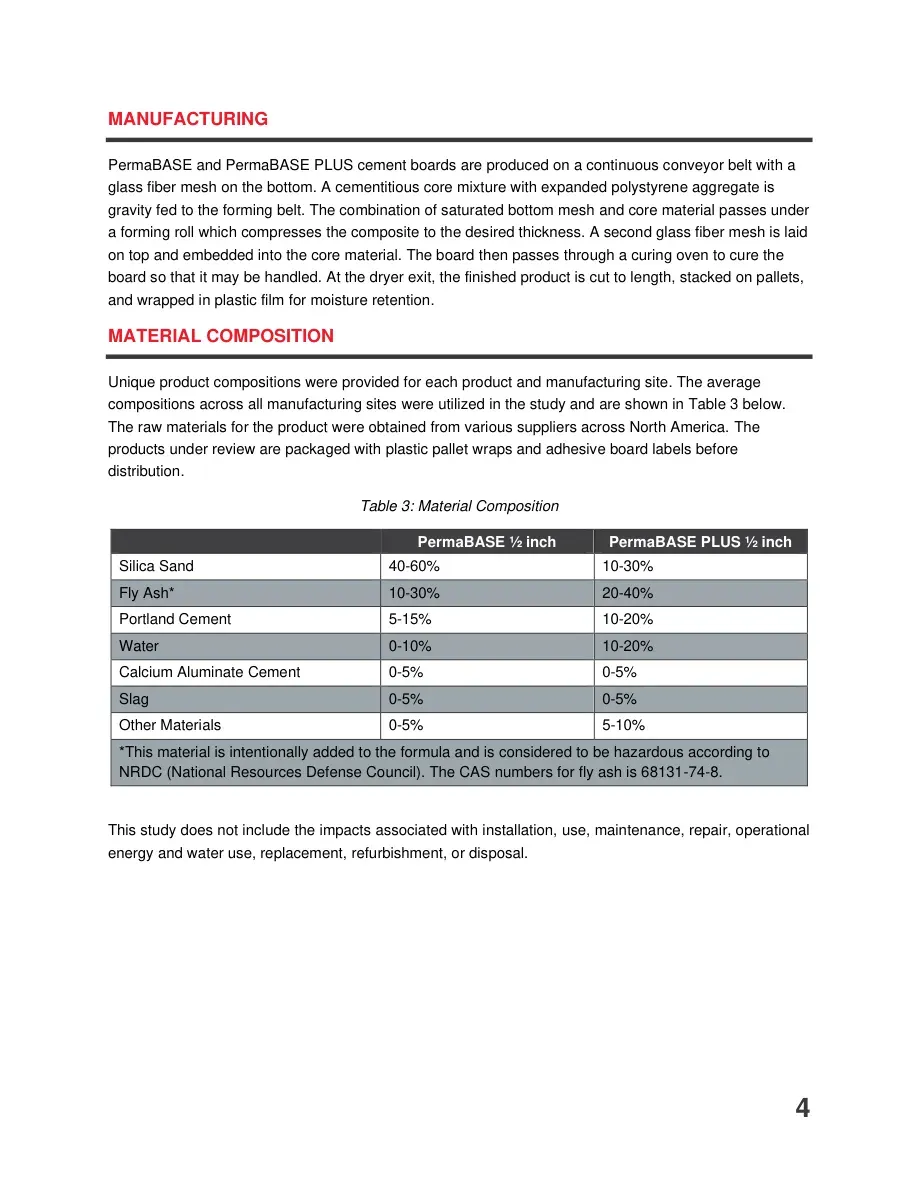
4MANUFACTURING PermaBASE and PermaBASE PLUS cement boards are produced on a continuous conveyor belt with a glass fiber mesh on the bottom. A cementitious core mixture with expanded polystyrene aggregate is gravity fed to the forming belt. The combination of saturated bottom mesh and core material passes under a forming roll which compresses the composite to the desired thickness. A second glass fiber mesh is laid on top and embedded into the core material. The board then passes through a curing oven to cure the board so that it may be handled. At the dryer exit, the finished product is cut to length, stacked on pallets, and wrapped in plastic film for moisture retention. MATERIAL COMPOSITION Unique product compositions were provided for each product and manufacturing site. The average compositions across all manufacturing sites were utilized in the study and are shown in Table 3 below. The raw materials for the product were obtained from various suppliers across North America. The products under review are packaged with plastic pallet wraps and adhesive board labels before distribution. Table 3: Material Composition PermaBASE ½ inch PermaBASE PLUS ½ inch Silica Sand 40-60% 10-30% Fly Ash* 10-30% 20-40% Portland Cement 5-15% 10-20% Water 0-10% 10-20% Calcium Aluminate Cement 0-5% 0-5% Slag 0-5% 0-5% Other Materials 0-5% 5-10% *This material is intentionally added to the formula and is considered to be hazardous according to NRDC (National Resources Defense Council). The CAS numbers for fly ash is 68131-74-8. This study does not include the impacts associated with installation, use, maintenance, repair, operational energy and water use, replacement, refurbishment, or disposal.
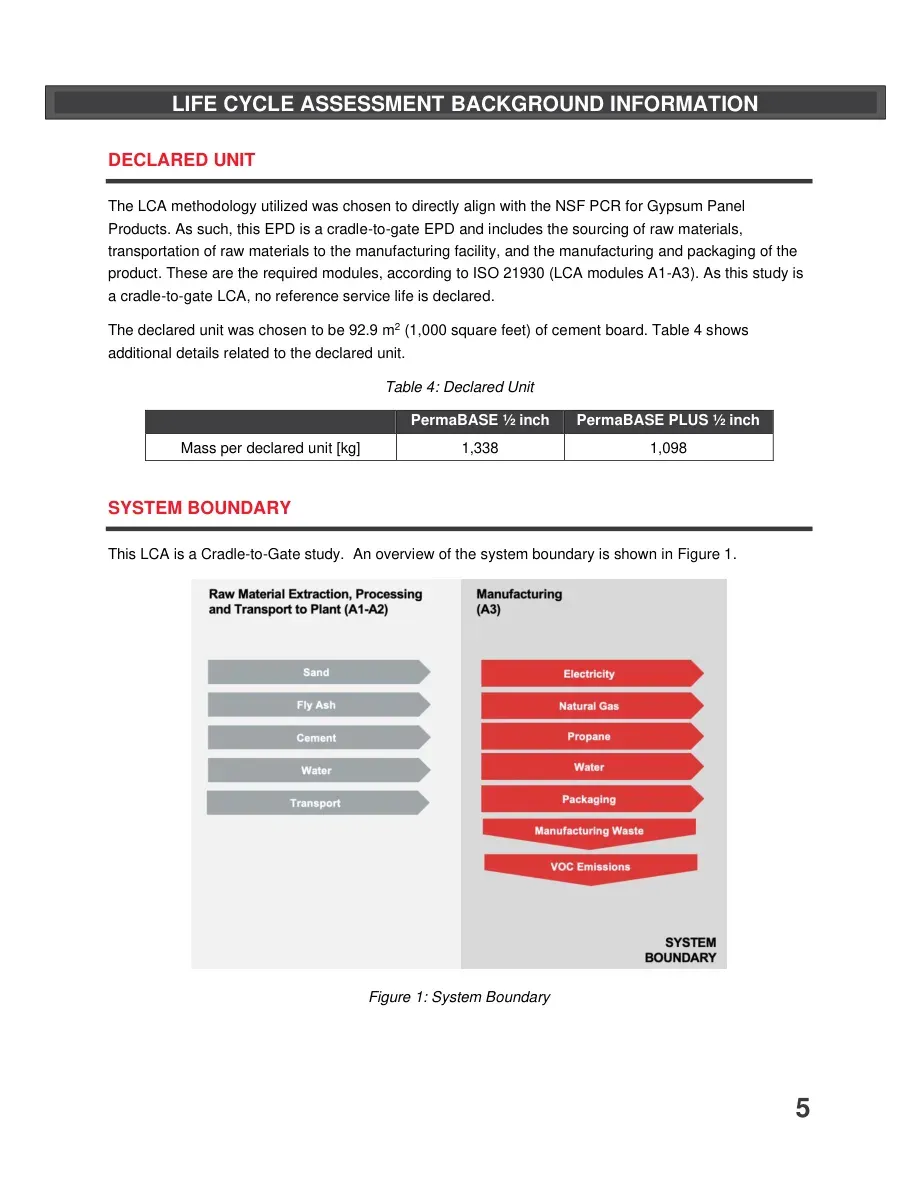
5 DECLARED UNIT The LCA methodology utilized was chosen to directly align with the NSF PCR for Gypsum Panel Products. As such, this EPD is a cradle-to-gate EPD and includes the sourcing of raw materials, transportation of raw materials to the manufacturing facility, and the manufacturing and packaging of the product. These are the required modules, according to ISO 21930 (LCA modules A1-A3). As this study is a cradle-to-gate LCA, no reference service life is declared. The declared unit was chosen to be 92.9 m2 (1,000 square feet) of cement board. Table 4 shows additional details related to the declared unit. Table 4: Declared Unit PermaBASE ½ inch PermaBASE PLUS ½ inch Mass per declared unit [kg] 1,338 1,098 SYSTEM BOUNDARY This LCA is a Cradle-to-Gate study. An overview of the system boundary is shown in Figure 1. Figure 1: System Boundary LIFE CYCLE ASSESSMENT BACKGROUND INFORMATION
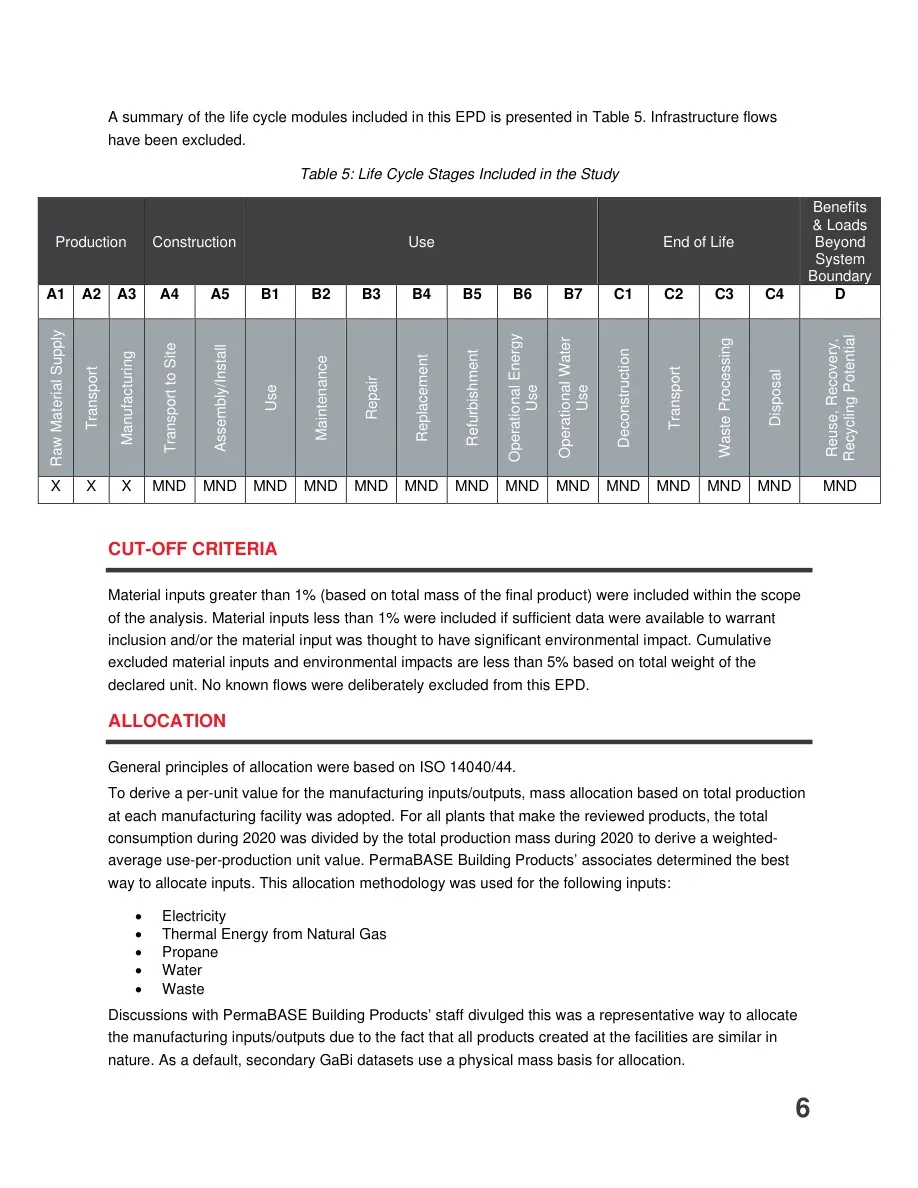
6A summary of the life cycle modules included in this EPD is presented in Table 5. Infrastructure flows have been excluded. Table 5: Life Cycle Stages Included in the Study Production Construction Use End of Life Benefits & Loads Beyond System Boundary A1 A2 A3 A4 A5 B1 B2 B3 B4 B5 B6 B7 C1 C2 C3 C4 D Raw Material Supply Transport Manufacturing Transport to Site Assembly/Install Use Maintenance Repair Replacement Refurbishment Operational Energy Use Operational Water Use Deconstruction Transport Waste Processing Disposal Reuse, Recovery, Recycling Potential X X X MND MND MND MND MND MND MND MND MND MND MND MND MND MND CUT-OFF CRITERIA Material inputs greater than 1% (based on total mass of the final product) were included within the scope of the analysis. Material inputs less than 1% were included if sufficient data were available to warrant inclusion and/or the material input was thought to have significant environmental impact. Cumulative excluded material inputs and environmental impacts are less than 5% based on total weight of the declared unit. No known flows were deliberately excluded from this EPD. ALLOCATION General principles of allocation were based on ISO 14040/44. To derive a per-unit value for the manufacturing inputs/outputs, mass allocation based on total production at each manufacturing facility was adopted. For all plants that make the reviewed products, the total consumption during 2020 was divided by the total production mass during 2020 to derive a weighted-average use-per-production unit value. PermaBASE Building Products’ associates determined the best way to allocate inputs. This allocation methodology was used for the following inputs: • Electricity • Thermal Energy from Natural Gas • Propane • Water • Waste Discussions with PermaBASE Building Products’ staff divulged this was a representative way to allocate the manufacturing inputs/outputs due to the fact that all products created at the facilities are similar in nature. As a default, secondary GaBi datasets use a physical mass basis for allocation.
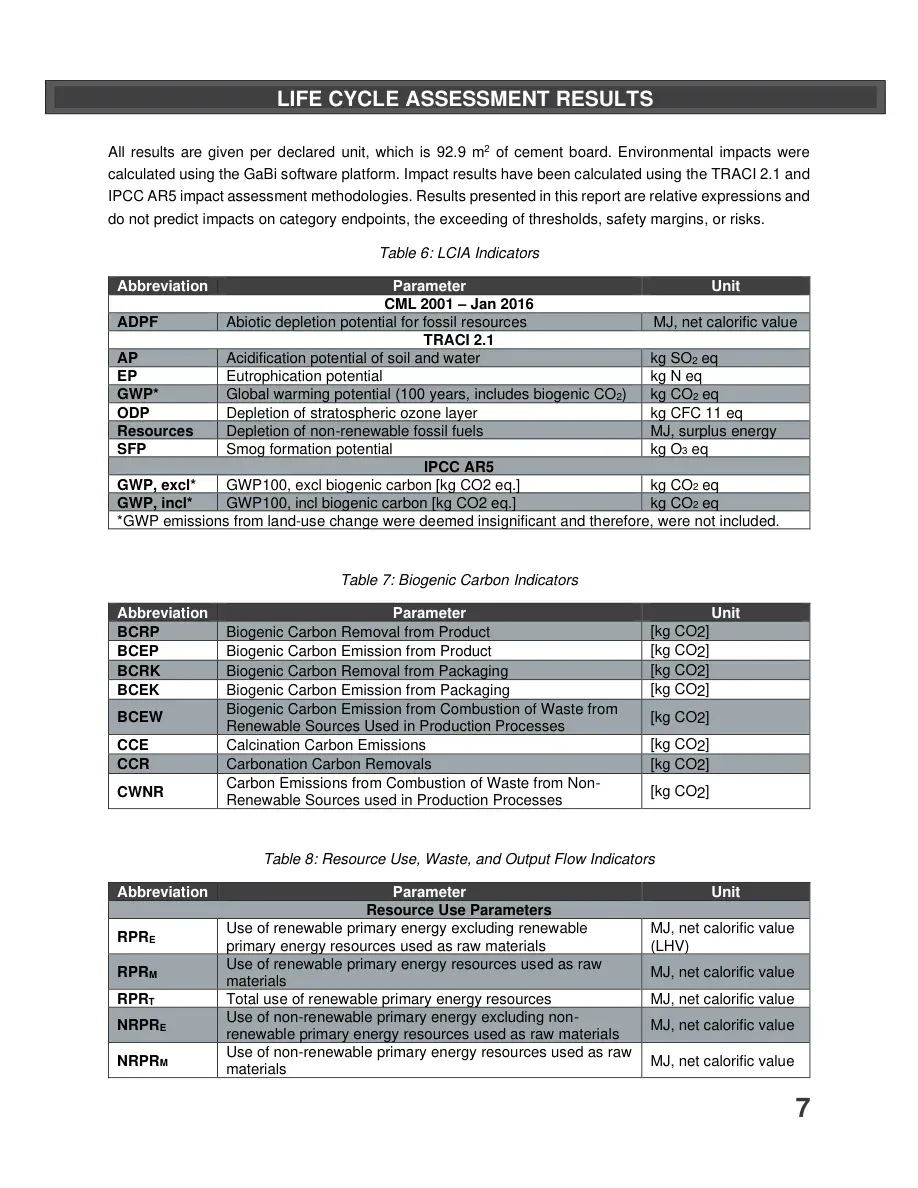
7 All results are given per declared unit, which is 92.9 m2 of cement board. Environmental impacts were calculated using the GaBi software platform. Impact results have been calculated using the TRACI 2.1 and IPCC AR5 impact assessment methodologies. Results presented in this report are relative expressions and do not predict impacts on category endpoints, the exceeding of thresholds, safety margins, or risks. Table 6: LCIA Indicators Abbreviation Parameter Unit CML 2001 – Jan 2016 ADPF Abiotic depletion potential for fossil resources MJ, net calorific value TRACI 2.1 AP Acidification potential of soil and water kg SO2 eq EP Eutrophication potential kg N eq GWP* Global warming potential (100 years, includes biogenic CO2) kg CO2 eq ODP Depletion of stratospheric ozone layer kg CFC 11 eq Resources Depletion of non-renewable fossil fuels MJ, surplus energy SFP Smog formation potential kg O3 eq IPCC AR5 GWP, excl* GWP100, excl biogenic carbon [kg CO2 eq.] kg CO2 eq GWP, incl* GWP100, incl biogenic carbon [kg CO2 eq.] kg CO2 eq *GWP emissions from land-use change were deemed insignificant and therefore, were not included. Table 7: Biogenic Carbon Indicators Abbreviation Parameter Unit BCRP Biogenic Carbon Removal from Product [kg CO2] BCEP Biogenic Carbon Emission from Product [kg CO2] BCRK Biogenic Carbon Removal from Packaging [kg CO2] BCEK Biogenic Carbon Emission from Packaging [kg CO2] BCEW Biogenic Carbon Emission from Combustion of Waste from Renewable Sources Used in Production Processes [kg CO2] CCE Calcination Carbon Emissions [kg CO2] CCR Carbonation Carbon Removals [kg CO2] CWNR Carbon Emissions from Combustion of Waste from Non- Renewable Sources used in Production Processes [kg CO2] Table 8: Resource Use, Waste, and Output Flow Indicators Abbreviation Parameter Unit Resource Use Parameters RPRE Use of renewable primary energy excluding renewable primary energy resources used as raw materials MJ, net calorific value (LHV) RPRM Use of renewable primary energy resources used as raw materials MJ, net calorific value RPRT Total use of renewable primary energy resources MJ, net calorific value NRPRE Use of non-renewable primary energy excluding non-renewable primary energy resources used as raw materials MJ, net calorific value NRPRM Use of non-renewable primary energy resources used as raw materials MJ, net calorific value LIFE CYCLE ASSESSMENT RESULTS
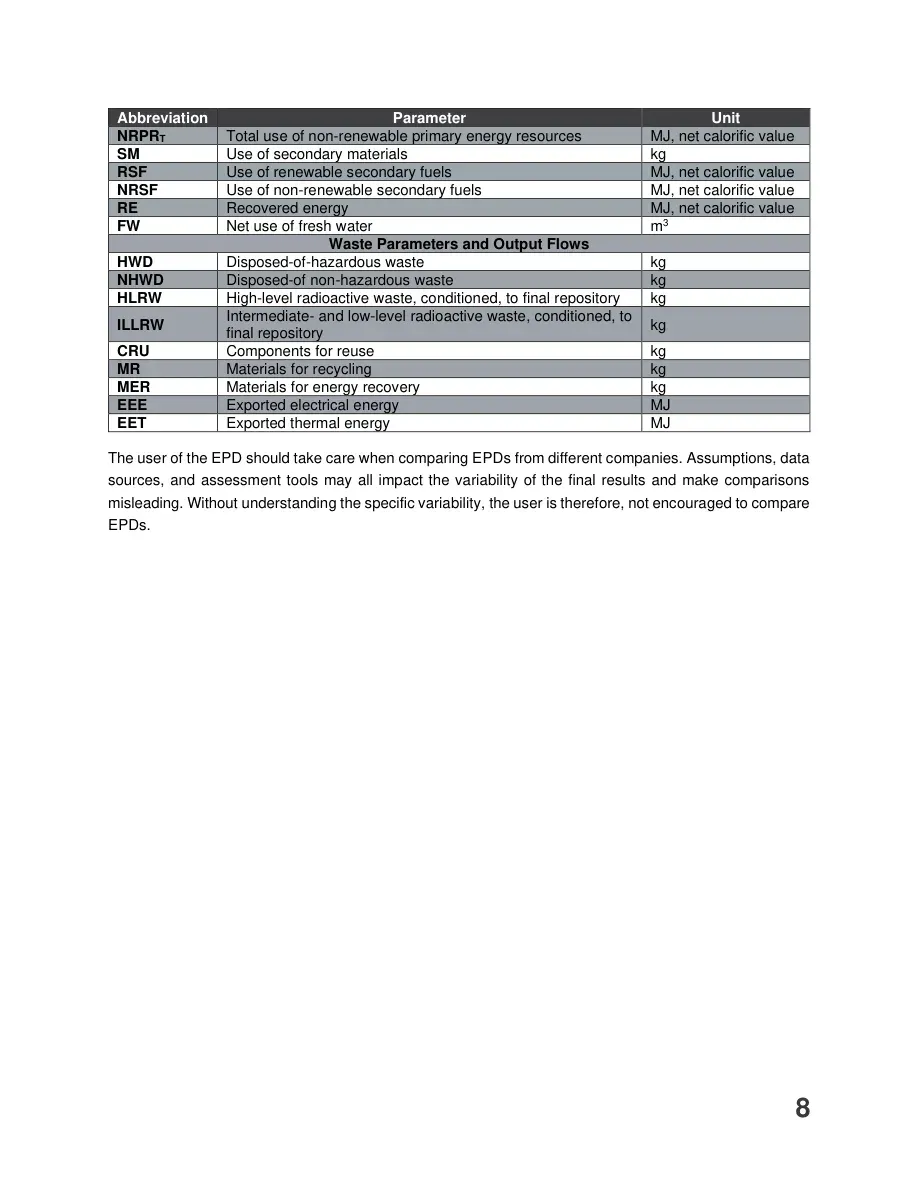
8Abbreviation Parameter Unit NRPRT Total use of non-renewable primary energy resources MJ, net calorific value SM Use of secondary materials kg RSF Use of renewable secondary fuels MJ, net calorific value NRSF Use of non-renewable secondary fuels MJ, net calorific value RE Recovered energy MJ, net calorific value FW Net use of fresh water m3 Waste Parameters and Output Flows HWD Disposed-of-hazardous waste kg NHWD Disposed-of non-hazardous waste kg HLRW High-level radioactive waste, conditioned, to final repository kg ILLRW Intermediate- and low-level radioactive waste, conditioned, to final repository kg CRU Components for reuse kg MR Materials for recycling kg MER Materials for energy recovery kg EEE Exported electrical energy MJ EET Exported thermal energy MJ The user of the EPD should take care when comparing EPDs from different companies. Assumptions, data sources, and assessment tools may all impact the variability of the final results and make comparisons misleading. Without understanding the specific variability, the user is therefore, not encouraged to compare EPDs.
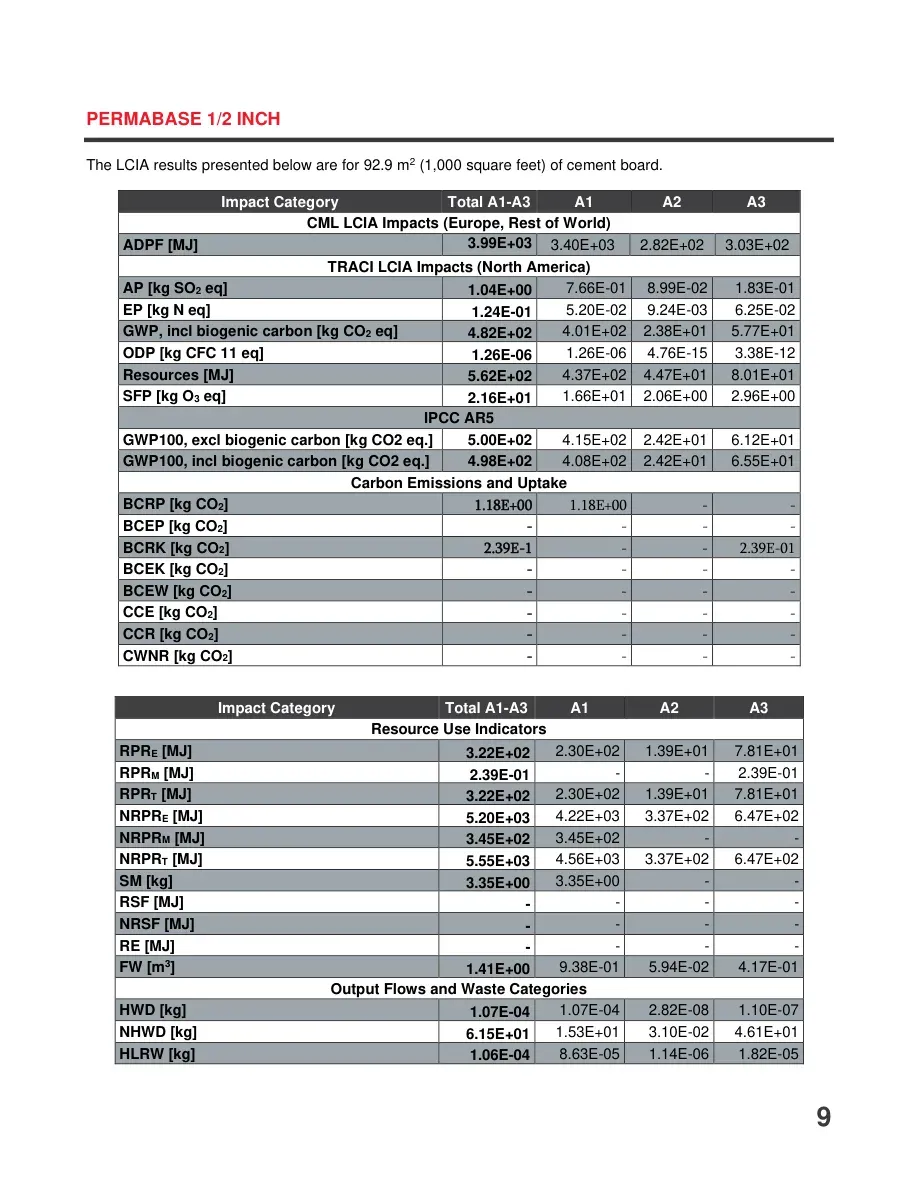
9 PERMABASE 1/2 INCH The LCIA results presented below are for 92.9 m2 (1,000 square feet) of cement board. Impact Category Total A1-A3 A1 A2 A3 CML LCIA Impacts (Europe, Rest of World) ADPF [MJ] 3.99E+03 3.40E+03 2.82E+02 3.03E+02 TRACI LCIA Impacts (North America) AP [kg SO2 eq] 1.04E+00 7.66E-01 8.99E-02 1.83E-01 EP [kg N eq] 1.24E-01 5.20E-02 9.24E-03 6.25E-02 GWP, incl biogenic carbon [kg CO2 eq] 4.82E+02 4.01E+02 2.38E+01 5.77E+01 ODP [kg CFC 11 eq] 1.26E-06 1.26E-06 4.76E-15 3.38E-12 Resources [MJ] 5.62E+02 4.37E+02 4.47E+01 8.01E+01 SFP [kg O3 eq] 2.16E+01 1.66E+01 2.06E+00 2.96E+00 IPCC AR5 GWP100, excl biogenic carbon [kg CO2 eq.] 5.00E+02 4.15E+02 2.42E+01 6.12E+01 GWP100, incl biogenic carbon [kg CO2 eq.] 4.98E+02 4.08E+02 2.42E+01 6.55E+01 Carbon Emissions and Uptake BCRP [kg CO2] 1.18E+00 1.18E+00 - - BCEP [kg CO2] - - - - BCRK [kg CO2] 2.39E-1 - - 2.39E-01 BCEK [kg CO2] - - - - BCEW [kg CO2] - - - - CCE [kg CO2] - - - - CCR [kg CO2] - - - - CWNR [kg CO2] - - - - Impact Category Total A1-A3 A1 A2 A3 Resource Use Indicators RPRE [MJ] 3.22E+02 2.30E+02 1.39E+01 7.81E+01 RPRM [MJ] 2.39E-01 - - 2.39E-01 RPRT [MJ] 3.22E+02 2.30E+02 1.39E+01 7.81E+01 NRPRE [MJ] 5.20E+03 4.22E+03 3.37E+02 6.47E+02 NRPRM [MJ] 3.45E+02 3.45E+02 - - NRPRT [MJ] 5.55E+03 4.56E+03 3.37E+02 6.47E+02 SM [kg] 3.35E+00 3.35E+00 - - RSF [MJ] - - - - NRSF [MJ] - - - - RE [MJ] - - - - FW [m3] 1.41E+00 9.38E-01 5.94E-02 4.17E-01 Output Flows and Waste Categories HWD [kg] 1.07E-04 1.07E-04 2.82E-08 1.10E-07 NHWD [kg] 6.15E+01 1.53E+01 3.10E-02 4.61E+01 HLRW [kg] 1.06E-04 8.63E-05 1.14E-06 1.82E-05
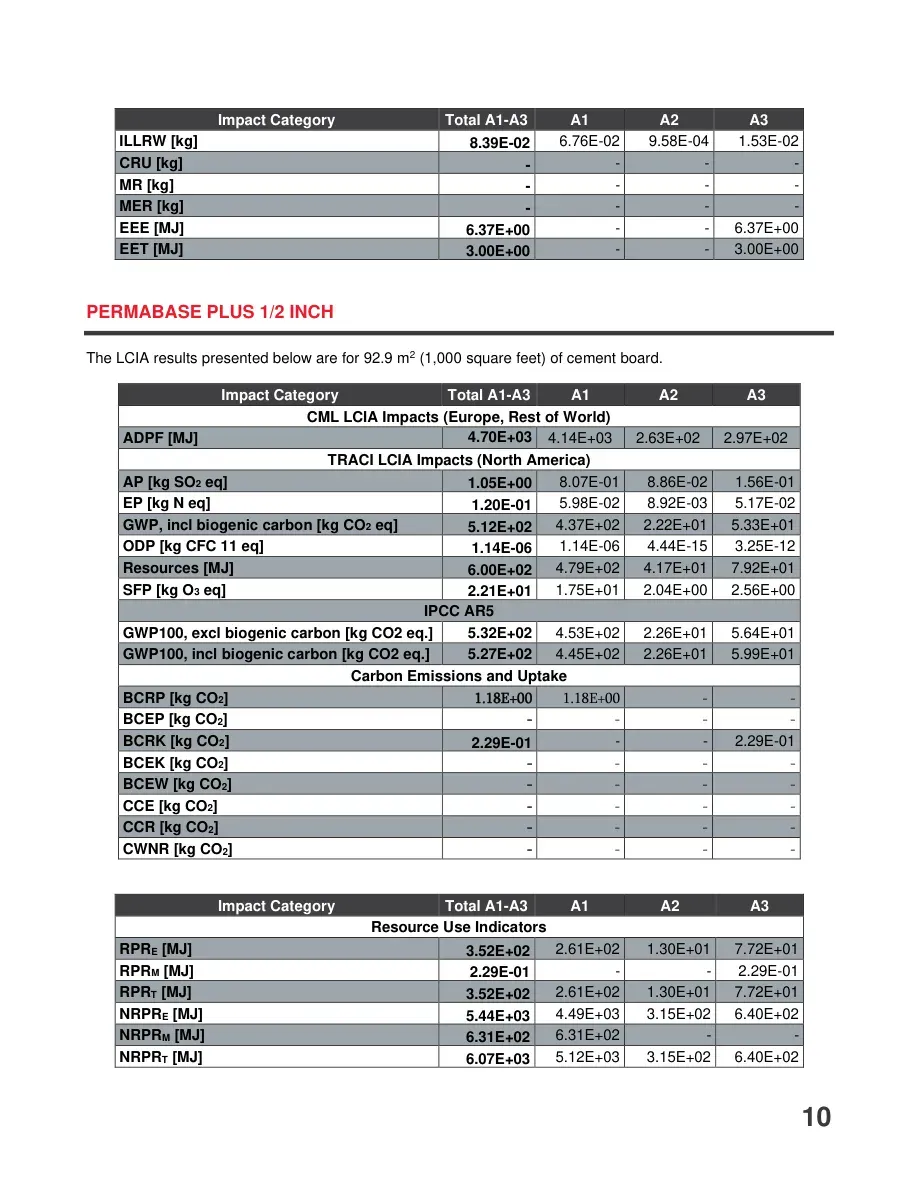
10 Impact Category Total A1-A3 A1 A2 A3 ILLRW [kg] 8.39E-02 6.76E-02 9.58E-04 1.53E-02 CRU [kg] - - - - MR [kg] - - - - MER [kg] - - - - EEE [MJ] 6.37E+00 - - 6.37E+00 EET [MJ] 3.00E+00 - - 3.00E+00 PERMABASE PLUS 1/2 INCH The LCIA results presented below are for 92.9 m2 (1,000 square feet) of cement board. Impact Category Total A1-A3 A1 A2 A3 CML LCIA Impacts (Europe, Rest of World) ADPF [MJ] 4.70E+03 4.14E+03 2.63E+02 2.97E+02 TRACI LCIA Impacts (North America) AP [kg SO2 eq] 1.05E+00 8.07E-01 8.86E-02 1.56E-01 EP [kg N eq] 1.20E-01 5.98E-02 8.92E-03 5.17E-02 GWP, incl biogenic carbon [kg CO2 eq] 5.12E+02 4.37E+02 2.22E+01 5.33E+01 ODP [kg CFC 11 eq] 1.14E-06 1.14E-06 4.44E-15 3.25E-12 Resources [MJ] 6.00E+02 4.79E+02 4.17E+01 7.92E+01 SFP [kg O3 eq] 2.21E+01 1.75E+01 2.04E+00 2.56E+00 IPCC AR5 GWP100, excl biogenic carbon [kg CO2 eq.] 5.32E+02 4.53E+02 2.26E+01 5.64E+01 GWP100, incl biogenic carbon [kg CO2 eq.] 5.27E+02 4.45E+02 2.26E+01 5.99E+01 Carbon Emissions and Uptake BCRP [kg CO2] 1.18E+00 1.18E+00 - - BCEP [kg CO2] - - - - BCRK [kg CO2] 2.29E-01 - - 2.29E-01 BCEK [kg CO2] - - - - BCEW [kg CO2] - - - - CCE [kg CO2] - - - - CCR [kg CO2] - - - - CWNR [kg CO2] - - - - Impact Category Total A1-A3 A1 A2 A3 Resource Use Indicators RPRE [MJ] 3.52E+02 2.61E+02 1.30E+01 7.72E+01 RPRM [MJ] 2.29E-01 - - 2.29E-01 RPRT [MJ] 3.52E+02 2.61E+02 1.30E+01 7.72E+01 NRPRE [MJ] 5.44E+03 4.49E+03 3.15E+02 6.40E+02 NRPRM [MJ] 6.31E+02 6.31E+02 - - NRPRT [MJ] 6.07E+03 5.12E+03 3.15E+02 6.40E+02
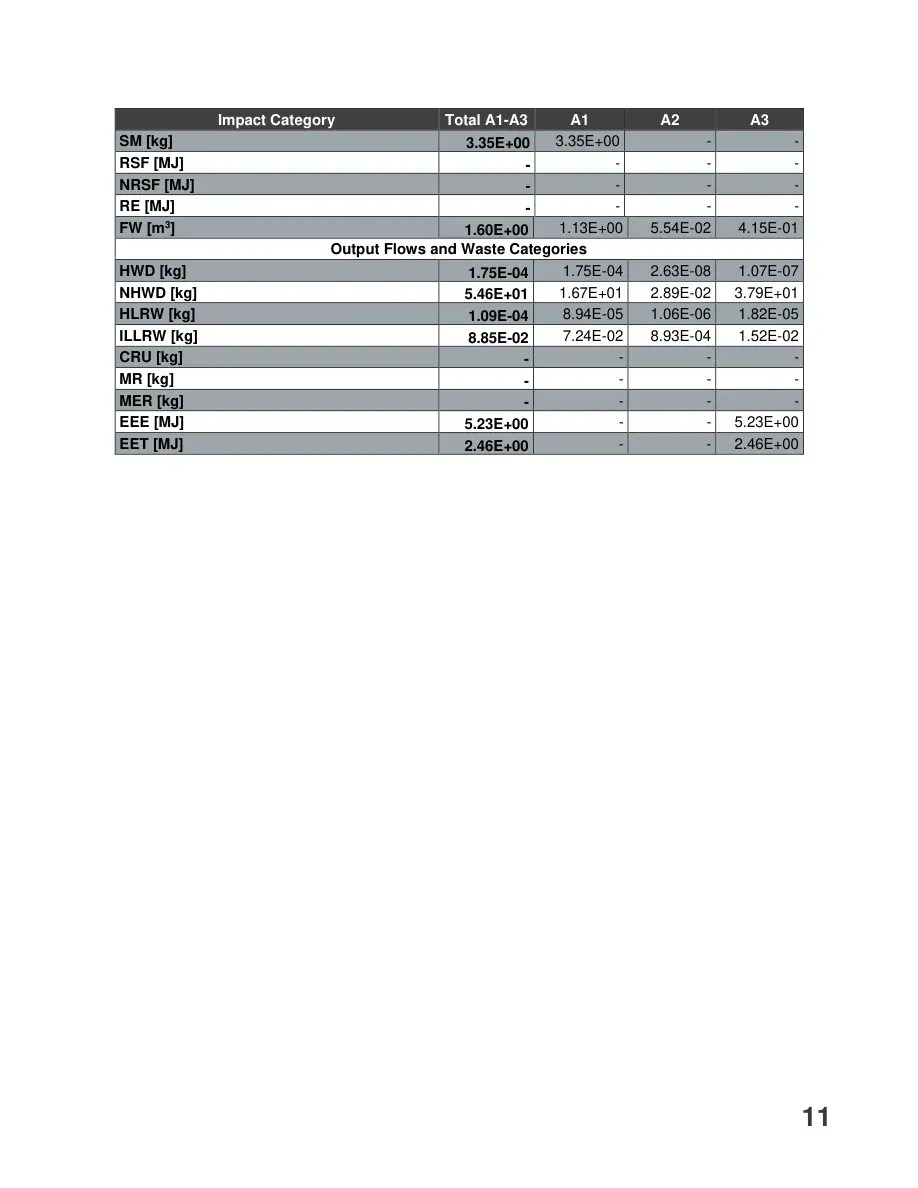
11 Impact Category Total A1-A3 A1 A2 A3 SM [kg] 3.35E+00 3.35E+00 - - RSF [MJ] - - - - NRSF [MJ] - - - - RE [MJ] - - - - FW [m3] 1.60E+00 1.13E+00 5.54E-02 4.15E-01 Output Flows and Waste Categories HWD [kg] 1.75E-04 1.75E-04 2.63E-08 1.07E-07 NHWD [kg] 5.46E+01 1.67E+01 2.89E-02 3.79E+01 HLRW [kg] 1.09E-04 8.94E-05 1.06E-06 1.82E-05 ILLRW [kg] 8.85E-02 7.24E-02 8.93E-04 1.52E-02 CRU [kg] - - - - MR [kg] - - - - MER [kg] - - - - EEE [MJ] 5.23E+00 - - 5.23E+00 EET [MJ] 2.46E+00 - - 2.46E+00
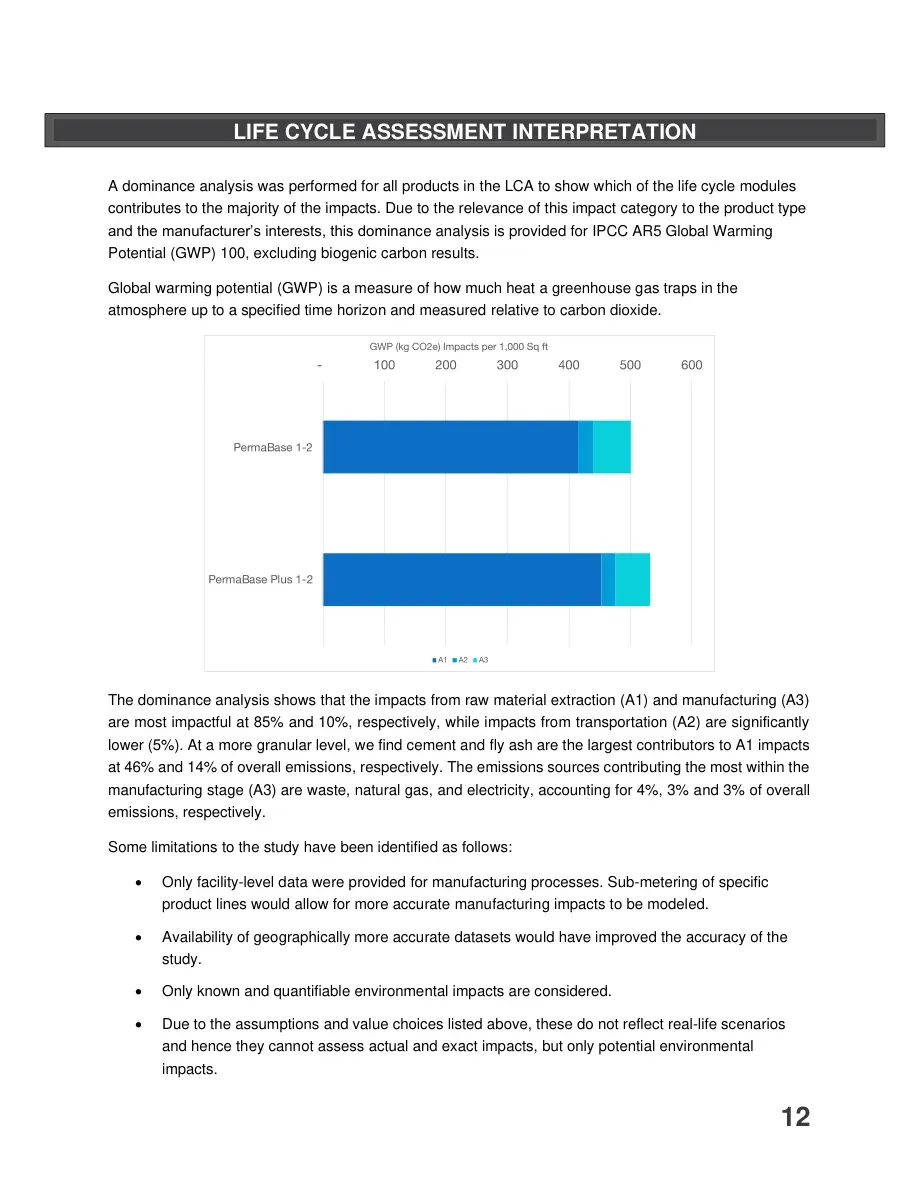
12 A dominance analysis was performed for all products in the LCA to show which of the life cycle modules contributes to the majority of the impacts. Due to the relevance of this impact category to the product type and the manufacturer’s interests, this dominance analysis is provided for IPCC AR5 Global Warming Potential (GWP) 100, excluding biogenic carbon results. Global warming potential (GWP) is a measure of how much heat a greenhouse gas traps in the atmosphere up to a specified time horizon and measured relative to carbon dioxide. The dominance analysis shows that the impacts from raw material extraction (A1) and manufacturing (A3) are most impactful at 85% and 10%, respectively, while impacts from transportation (A2) are significantly lower (5%). At a more granular level, we find cement and fly ash are the largest contributors to A1 impacts at 46% and 14% of overall emissions, respectively. The emissions sources contributing the most within the manufacturing stage (A3) are waste, natural gas, and electricity, accounting for 4%, 3% and 3% of overall emissions, respectively. Some limitations to the study have been identified as follows: • Only facility-level data were provided for manufacturing processes. Sub-metering of specific product lines would allow for more accurate manufacturing impacts to be modeled. • Availability of geographically more accurate datasets would have improved the accuracy of the study. • Only known and quantifiable environmental impacts are considered. • Due to the assumptions and value choices listed above, these do not reflect real-life scenarios and hence they cannot assess actual and exact impacts, but only potential environmental impacts. LIFE CYCLE ASSESSMENT INTERPRETATION
13 1. CML - Department of Industrial Ecology. (2016, September 05). CML-IA Characterisation Factors. Retrieved from https://www.universiteitleiden.nl/en/research/research-output/science/cml-ia-characterisation-factors 2. IPCC. (2013). Climate Change 2013: The Physical Science Basis. Contributin of Working Group I to the Fifth Assessment Report of the Intergovernmental Panel on Climate Change. [Stocker, T.F., D. Qin, G.-K. Plattner, M. Tignor, S.K. Allen, J. Boschung, A. Nauels, Y. Xia, V. Bex and P.M. Midgley (eds.)]. Cambrige, United Kingdom and New York, NY, USA: Cambridge University press. 3. ISO. (2006). ISO 14025: Environmental labels and declarations - Type III environmental declarations - Principles and procedures. Geneva: International Organization for Standardization. 4. ISO. (2006). ISO 14040/Amd 1:2020: Environmental management - Life cycle assessment - Principles and framework. Geneva: International Organization for Standardization. 5. ISO. (2017). ISO 14044/Amd 1:2017/Amd 2:2020: Environemntal Managment - Life cycle assessment - Requirements and Guidelines. Geneva: International Organization for Standardization. 6. ISO. (2017). ISO 21930: Sustainability in buildings and civil engineering works - Core rules for environmental product declarations of construction products and services. Geneva: International Organization for Standardization. 7. NSF International. (April 2020). Product Category Rule Environmental Product Declarations, PCR for Gypsum Panel Products. 8. US EPA. (2012). TRACI: The Tool for the Reduction and Assessment of Chemical and Other Environmental Impacts. Version 2.1 - User Guide. Retrieved from https://nepis.epa.gov/Adobe/PDF/P100HN53.pdf REFERENCES