1 ENVIRONMENTAL PRODUCT DECLARATION GOLD BOND® XP® GYPSUM BOARD AND GOLD BOND® XP® FIRE-SHIELD® GYPSUM BOARD ACCORDING TO ISO 14025 AND ISO 21930 Type III environmental product declaration (EPD) developed according to ISO 14025 and 21930 for Gold Bond® XP® Gypsum Board and Gold Bond® XP® Fire-Shield® Gypsum Board National Gypsum Company is the exclusive service provider for products manufactured by Gold Bond Building Products, LLC.
2 Program Operator NSF Certification LLC 789 N. Dixboro, Ann Arbor, MI 48105 www.nsf.org Manufacturer Name and Address Gold Bond Building Products, LLC 2001 Rexford Road Charlotte, NC 28211 Declaration Number EPD11044 Declared Product and Declared Unit 92.9 m2 (1,000 square feet) of Gold Bond® XP® Gypsum Board 1/2 inch and Gold Bond® XP® Fire-Shield® Gypsum Board 5/8 inch Reference PCR and Version Number NSF PCR for Gypsum Panel Products (Version 1.1, 2020) Product’s Intended Application and Use Products are designed to provide extra protection against mold and mildew. Applications include wood- and steel-framed construction for interior wall and ceiling applications. Markets of Applicability North America Date of Issue 05/23/2025 Period of Validity 5 years from date of issue EPD Type Product Specific Range of Dataset Variability N/A EPD Scope Cradle-to-Gate Year of reported manufacturer primary data 2020 LCA Software and Version Number GaBi 10.0.0.71 LCI Database and Version Number GaBi Database 2021.2 LCIA Methodology and Version Number TRACI 2.1 The sub-category PCR review was conducted by: • Thomas P. Gloria, Industrial Ecology Consultants • Bill Stough, Sustainable Research Group • Jack Geibig, EcoForm This declaration was independently verified in accordance with ISO 14025: 2006. The NSF PCR for Gypsum Panel Products (Version 1.1) serves as the core PCR. Internal External Jack Geibig - EcoForm jgeibig@ecoform.com This life cycle assessment was conducted in accordance with ISO 14044 and the reference PCR by: Maggie Wildnauer, WAP Sustainability Consulting, LLC This life cycle assessment was independently verified in accordance with ISO 14044 and the reference PCR by: Jack Geibig - EcoForm jgeibig@ecoform.com Limitations: Environmental declarations from different programs (ISO 14025) may not be comparable. Only EPDs prepared from cradle-to-grave life-cycle results and based on the same function, reference service life, and quantified by the same functional unit, and meeting all the conditions in ISO 14025, Section 6.7.2, can be used to assist purchasers and users in making informed comparisons between products. Full conformance with the PCR for Products allows EPD comparability only when all stages of a life cycle have been considered. However, variations and deviations are possible. Example of variations: Different LCA software and background LCI datasets may lead to differences results for upstream or downstream of the life cycle stages declared. Additional information on the life cycle assessment can be found by contacting National Gypsum directly.
3 DESCRIPTION OF COMPANY National Gypsum Company, headquartered in Charlotte, NC, is the exclusive service provider of reliable, high-performance building products manufactured by its affiliate companies and marketed under the Gold Bond®, ProForm®, and PermaBASE® brands. PRODUCT DESCRIPTION Gold Bond® XP® Gypsum Board and Gold Bond® XP® Fire-Shield Gypsum were designed to provide extra protection against mold and mildew compared to standard gypsum board products. These products are available with a regular (1/2-inch board) and a specially treated, fire-resistant, Type X gypsum core (5/8-inch board). The face paper is folded around the long edges to reinforce and protect the core, and the ends are square-cut and finished smooth. Long edges of the panels are tapered. With purple paper on the face side, mold, mildew, and moisture resistance, and 100% recycled gray paper on the back side, you can count on XP Gypsum Board to help protect your projects from mold. This EPD includes representative products manufactured by National Gypsum’s affiliate, Gold Bond Building Products, produced at the facilities shown in the table below. The facilities shown below produce XP® boards in both thicknesses covered under this study: 1/2 inch and 5/8 inch. A weighted average of each manufacturing input (energy, water, waste, etc.) was utilized based on 2020 production as products are made at multiple facilities. Therefore, data from any given manufacturing site might be meaningfully different than the values reported in this EPD. Table 1: Manufacturing Facilities XP® Fire-Shield ½” Production Share [%] XP® Fire-Shield 5/8” Production Share [%] Apollo Beach, FL 11% Apollo Beach, FL 12% Baltimore, MD 15% Baltimore, MD 14% Burlington, NJ 8% Burlington, NJ 13% Fort Dodge, IA 5% Fort Dodge, IA 3% Long Beach, CA ≥0% Long Beach, CA ≥0% Medicine Lodge, KS 3% Medicine Lodge, KS 2% Mount Holly, NC 12% Mount Holly, NC 10% National City, MI 3% National City, MI 1% Phoenix, AZ 1% Phoenix, AZ 3% Portsmouth, NH 7% Portsmouth, NH 5% Richmond, CA 6% Richmond, CA 3% Rotan, TX 2% Rotan, TX 4% Savannah, GA ≥0% Savannah, GA ≥0% Shippingport, PA 11% Shippingport, PA 18% Shoals, IN 4% Shoals, IN 4% Waukegan, IL 3% Waukegan, IL 2% Westwego, LA 5% Westwego, LA 3% Wilmington, NC 4% Wilmington, NC 3%
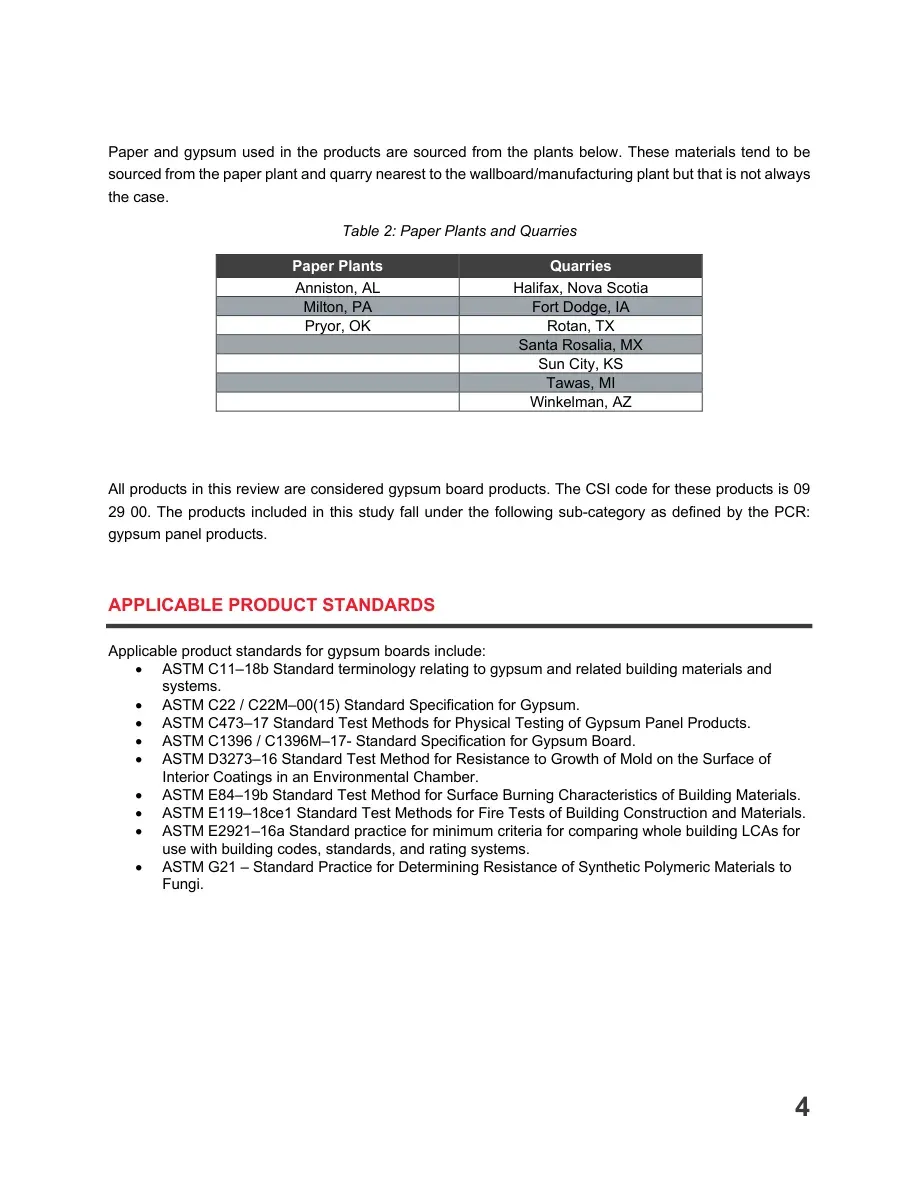
4 Paper and gypsum used in the products are sourced from the plants below. These materials tend to be sourced from the paper plant and quarry nearest to the wallboard/manufacturing plant but that is not always the case. Table 2: Paper Plants and Quarries Paper Plants Quarries Anniston, AL Halifax, Nova Scotia Milton, PA Fort Dodge, IA Pryor, OK Rotan, TX Santa Rosalia, MX Sun City, KS Tawas, MI Winkelman, AZ All products in this review are considered gypsum board products. The CSI code for these products is 09 29 00. The products included in this study fall under the following sub-category as defined by the PCR: gypsum panel products. APPLICABLE PRODUCT STANDARDS Applicable product standards for gypsum boards include: • ASTM C11–18b Standard terminology relating to gypsum and related building materials and systems. • ASTM C22 / C22M–00(15) Standard Specification for Gypsum. • ASTM C473–17 Standard Test Methods for Physical Testing of Gypsum Panel Products. • ASTM C1396 / C1396M–17- Standard Specification for Gypsum Board. • ASTM D3273–16 Standard Test Method for Resistance to Growth of Mold on the Surface of Interior Coatings in an Environmental Chamber. • ASTM E84–19b Standard Test Method for Surface Burning Characteristics of Building Materials. • ASTM E119–18ce1 Standard Test Methods for Fire Tests of Building Construction and Materials. • ASTM E2921–16a Standard practice for minimum criteria for comparing whole building LCAs for use with building codes, standards, and rating systems. • ASTM G21 – Standard Practice for Determining Resistance of Synthetic Polymeric Materials to Fungi.
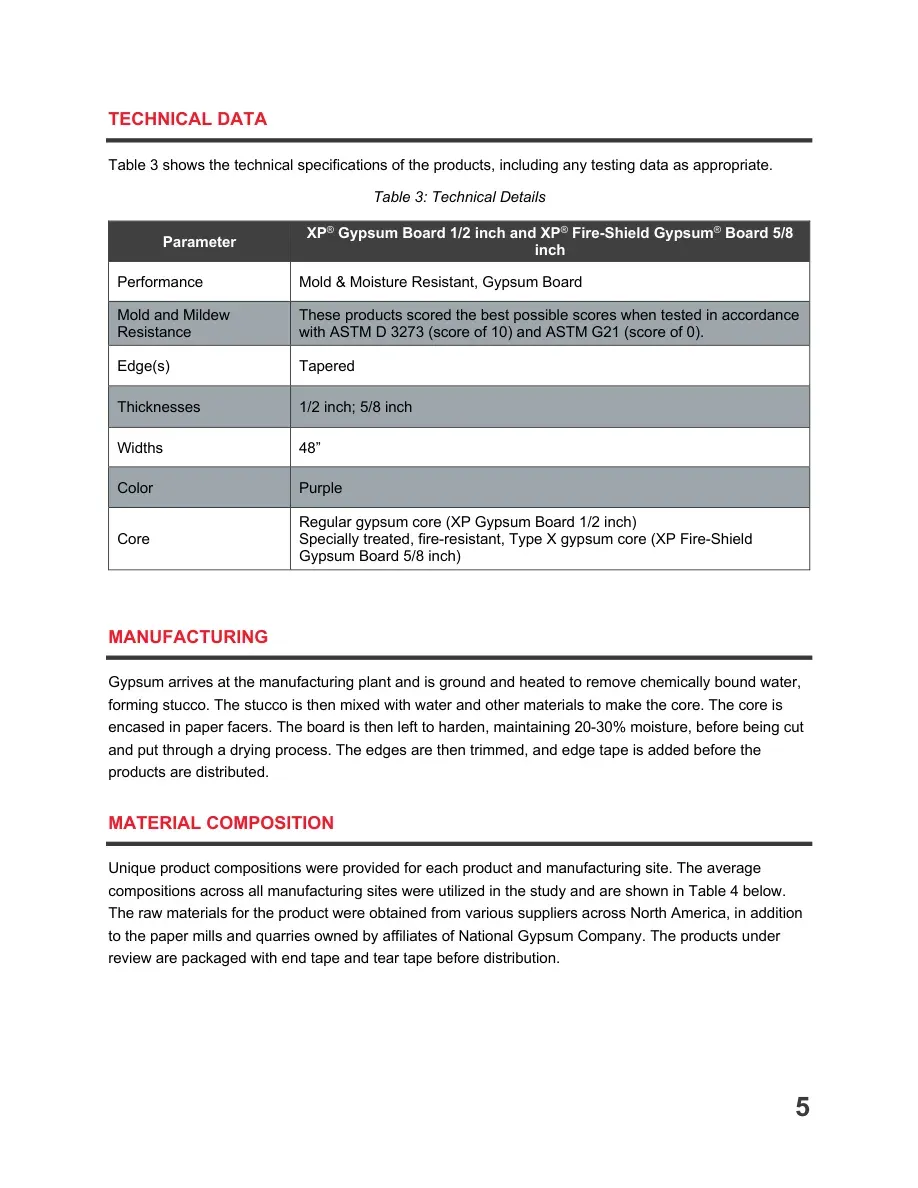
5 TECHNICAL DATA Table 3 shows the technical specifications of the products, including any testing data as appropriate. Table 3: Technical Details Parameter XP® Gypsum Board 1/2 inch and XP® Fire-Shield Gypsum® Board 5/8 inch Performance Mold & Moisture Resistant, Gypsum Board Mold and Mildew Resistance These products scored the best possible scores when tested in accordance with ASTM D 3273 (score of 10) and ASTM G21 (score of 0). Edge(s) Tapered Thicknesses 1/2 inch; 5/8 inch Widths 48” Color Purple Core Regular gypsum core (XP Gypsum Board 1/2 inch) Specially treated, fire-resistant, Type X gypsum core (XP Fire-Shield Gypsum Board 5/8 inch) MANUFACTURING Gypsum arrives at the manufacturing plant and is ground and heated to remove chemically bound water, forming stucco. The stucco is then mixed with water and other materials to make the core. The core is encased in paper facers. The board is then left to harden, maintaining 20-30% moisture, before being cut and put through a drying process. The edges are then trimmed, and edge tape is added before the products are distributed. MATERIAL COMPOSITION Unique product compositions were provided for each product and manufacturing site. The average compositions across all manufacturing sites were utilized in the study and are shown in Table 4 below. The raw materials for the product were obtained from various suppliers across North America, in addition to the paper mills and quarries owned by affiliates of National Gypsum Company. The products under review are packaged with end tape and tear tape before distribution.
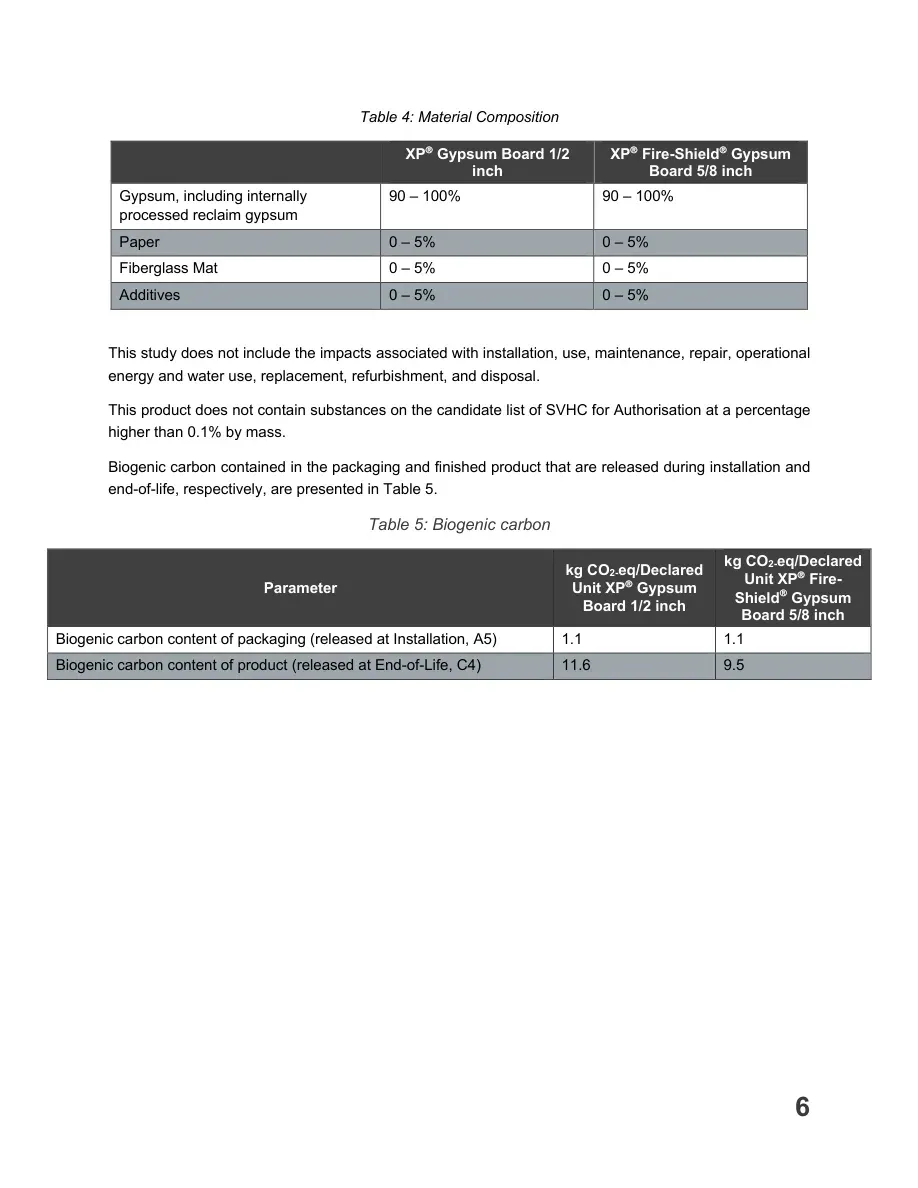
6 Table 4: Material Composition XP® Gypsum Board 1/2 inch XP® Fire-Shield® Gypsum Board 5/8 inch Gypsum, including internally processed reclaim gypsum 90 – 100% 90 – 100% Paper 0 – 5% 0 – 5% Fiberglass Mat 0 – 5% 0 – 5% Additives 0 – 5% 0 – 5% This study does not include the impacts associated with installation, use, maintenance, repair, operational energy and water use, replacement, refurbishment, and disposal. This product does not contain substances on the candidate list of SVHC for Authorisation at a percentage higher than 0.1% by mass. Biogenic carbon contained in the packaging and finished product that are released during installation and end-of-life, respectively, are presented in Table 5. Table 5: Biogenic carbon Parameter kg CO2-eq/Declared Unit XP® Gypsum Board 1/2 inch kg CO2-eq/Declared Unit XP® Fire-Shield® Gypsum Board 5/8 inch Biogenic carbon content of packaging (released at Installation, A5) 1.1 1.1 Biogenic carbon content of product (released at End-of-Life, C4) 11.6 9.5
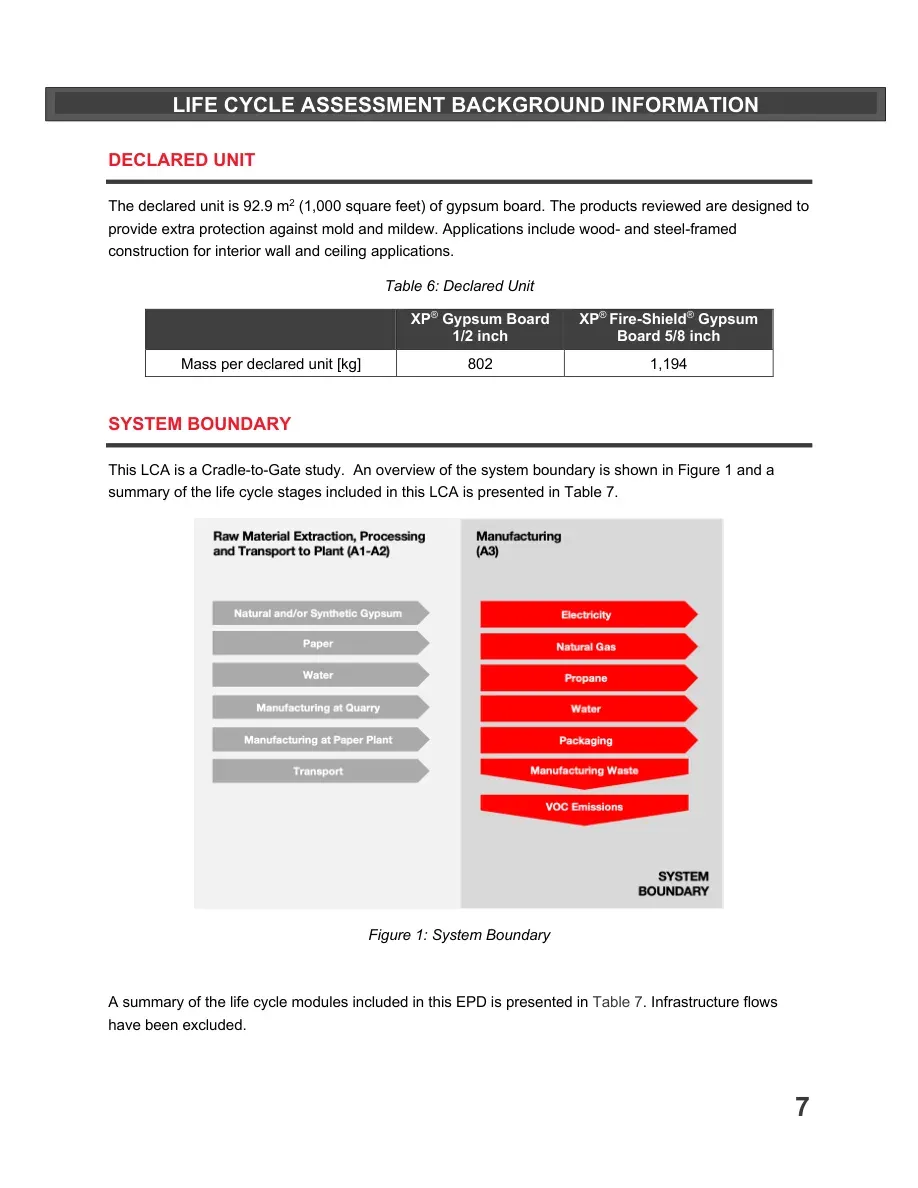
7 DECLARED UNIT The declared unit is 92.9 m2 (1,000 square feet) of gypsum board. The products reviewed are designed to provide extra protection against mold and mildew. Applications include wood- and steel-framed construction for interior wall and ceiling applications. Table 6: Declared Unit XP® Gypsum Board 1/2 inch XP® Fire-Shield® Gypsum Board 5/8 inch Mass per declared unit [kg] 802 1,194 SYSTEM BOUNDARY This LCA is a Cradle-to-Gate study. An overview of the system boundary is shown in Figure 1 and a summary of the life cycle stages included in this LCA is presented in Table 7. Figure 1: System Boundary A summary of the life cycle modules included in this EPD is presented in Table 7. Infrastructure flows have been excluded. LIFE CYCLE ASSESSMENT BACKGROUND INFORMATION
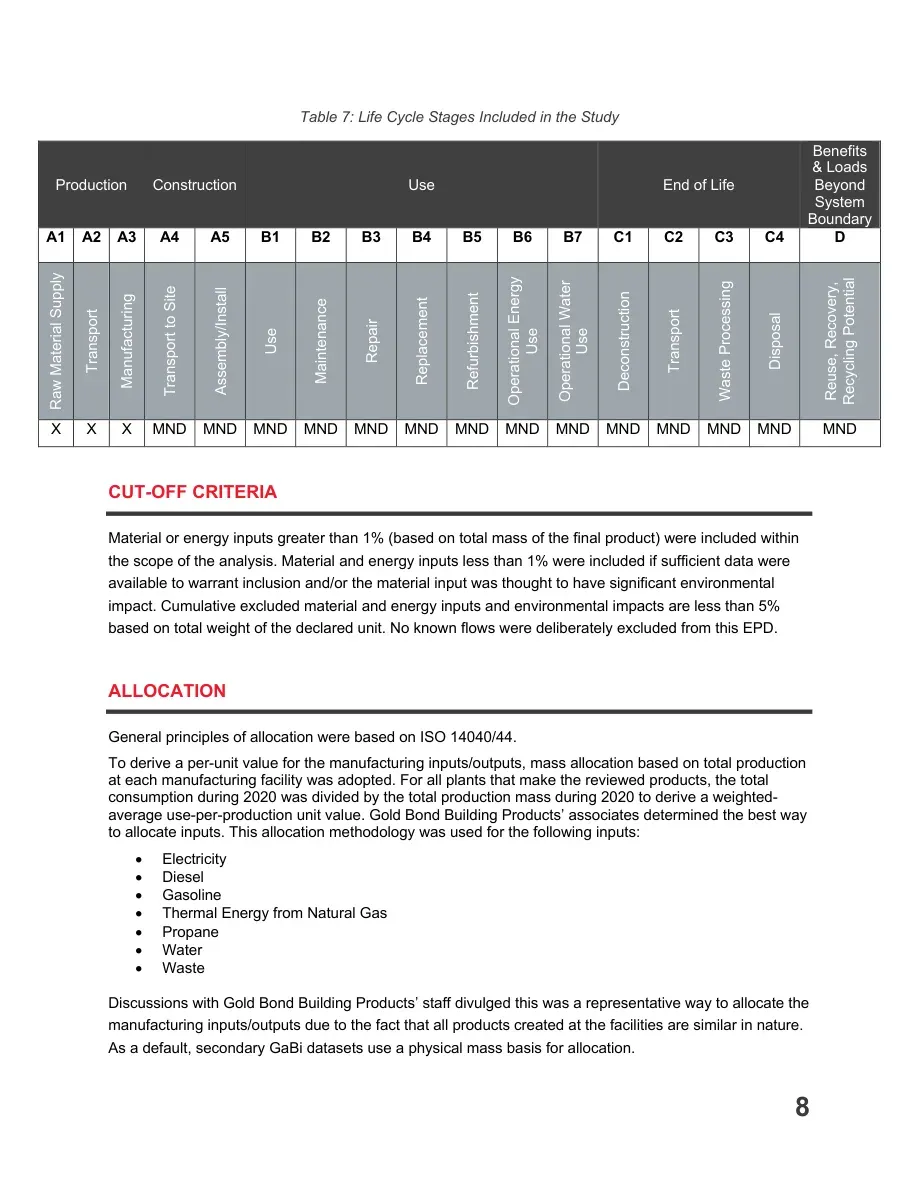
8 Table 7: Life Cycle Stages Included in the Study Production Construction Use End of Life Benefits & Loads Beyond System Boundary A1 A2 A3 A4 A5 B1 B2 B3 B4 B5 B6 B7 C1 C2 C3 C4 D Raw Material Supply Transport Manufacturing Transport to Site Assembly/Install Use Maintenance Repair Replacement Refurbishment Operational Energy Use Operational Water Use Deconstruction Transport Waste Processing Disposal Reuse, Recovery, Recycling Potential X X X MND MND MND MND MND MND MND MND MND MND MND MND MND MND CUT-OFF CRITERIA Material or energy inputs greater than 1% (based on total mass of the final product) were included within the scope of the analysis. Material and energy inputs less than 1% were included if sufficient data were available to warrant inclusion and/or the material input was thought to have significant environmental impact. Cumulative excluded material and energy inputs and environmental impacts are less than 5% based on total weight of the declared unit. No known flows were deliberately excluded from this EPD. ALLOCATION General principles of allocation were based on ISO 14040/44. To derive a per-unit value for the manufacturing inputs/outputs, mass allocation based on total production at each manufacturing facility was adopted. For all plants that make the reviewed products, the total consumption during 2020 was divided by the total production mass during 2020 to derive a weighted-average use-per-production unit value. Gold Bond Building Products’ associates determined the best way to allocate inputs. This allocation methodology was used for the following inputs: • Electricity • Diesel • Gasoline • Thermal Energy from Natural Gas • Propane • Water • Waste Discussions with Gold Bond Building Products’ staff divulged this was a representative way to allocate the manufacturing inputs/outputs due to the fact that all products created at the facilities are similar in nature. As a default, secondary GaBi datasets use a physical mass basis for allocation.
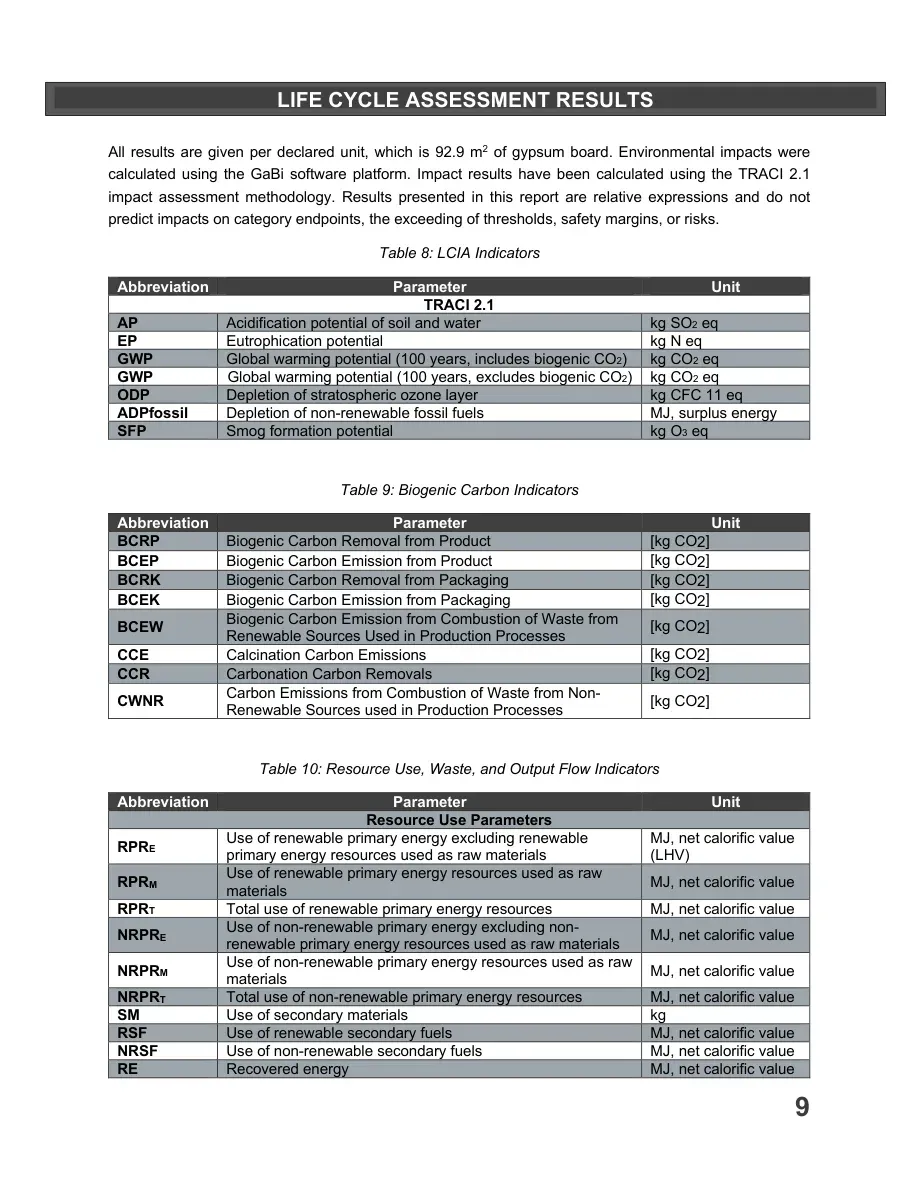
9 All results are given per declared unit, which is 92.9 m2 of gypsum board. Environmental impacts were calculated using the GaBi software platform. Impact results have been calculated using the TRACI 2.1 impact assessment methodology. Results presented in this report are relative expressions and do not predict impacts on category endpoints, the exceeding of thresholds, safety margins, or risks. Table 8: LCIA Indicators Abbreviation Parameter Unit TRACI 2.1 AP Acidification potential of soil and water kg SO2 eq EP Eutrophication potential kg N eq GWP Global warming potential (100 years, includes biogenic CO2) kg CO2 eq GWP Global warming potential (100 years, excludes biogenic CO2) kg CO2 eq ODP Depletion of stratospheric ozone layer kg CFC 11 eq ADPfossil Depletion of non-renewable fossil fuels MJ, surplus energy SFP Smog formation potential kg O3 eq Table 9: Biogenic Carbon Indicators Abbreviation Parameter Unit BCRP Biogenic Carbon Removal from Product [kg CO2] BCEP Biogenic Carbon Emission from Product [kg CO2] BCRK Biogenic Carbon Removal from Packaging [kg CO2] BCEK Biogenic Carbon Emission from Packaging [kg CO2] BCEW Biogenic Carbon Emission from Combustion of Waste from Renewable Sources Used in Production Processes [kg CO2] CCE Calcination Carbon Emissions [kg CO2] CCR Carbonation Carbon Removals [kg CO2] CWNR Carbon Emissions from Combustion of Waste from Non- Renewable Sources used in Production Processes [kg CO2] Table 10: Resource Use, Waste, and Output Flow Indicators Abbreviation Parameter Unit Resource Use Parameters RPRE Use of renewable primary energy excluding renewable primary energy resources used as raw materials MJ, net calorific value (LHV) RPRM Use of renewable primary energy resources used as raw materials MJ, net calorific value RPRT Total use of renewable primary energy resources MJ, net calorific value NRPRE Use of non-renewable primary energy excluding non-renewable primary energy resources used as raw materials MJ, net calorific value NRPRM Use of non-renewable primary energy resources used as raw materials MJ, net calorific value NRPRT Total use of non-renewable primary energy resources MJ, net calorific value SM Use of secondary materials kg RSF Use of renewable secondary fuels MJ, net calorific value NRSF Use of non-renewable secondary fuels MJ, net calorific value RE Recovered energy MJ, net calorific value LIFE CYCLE ASSESSMENT RESULTS
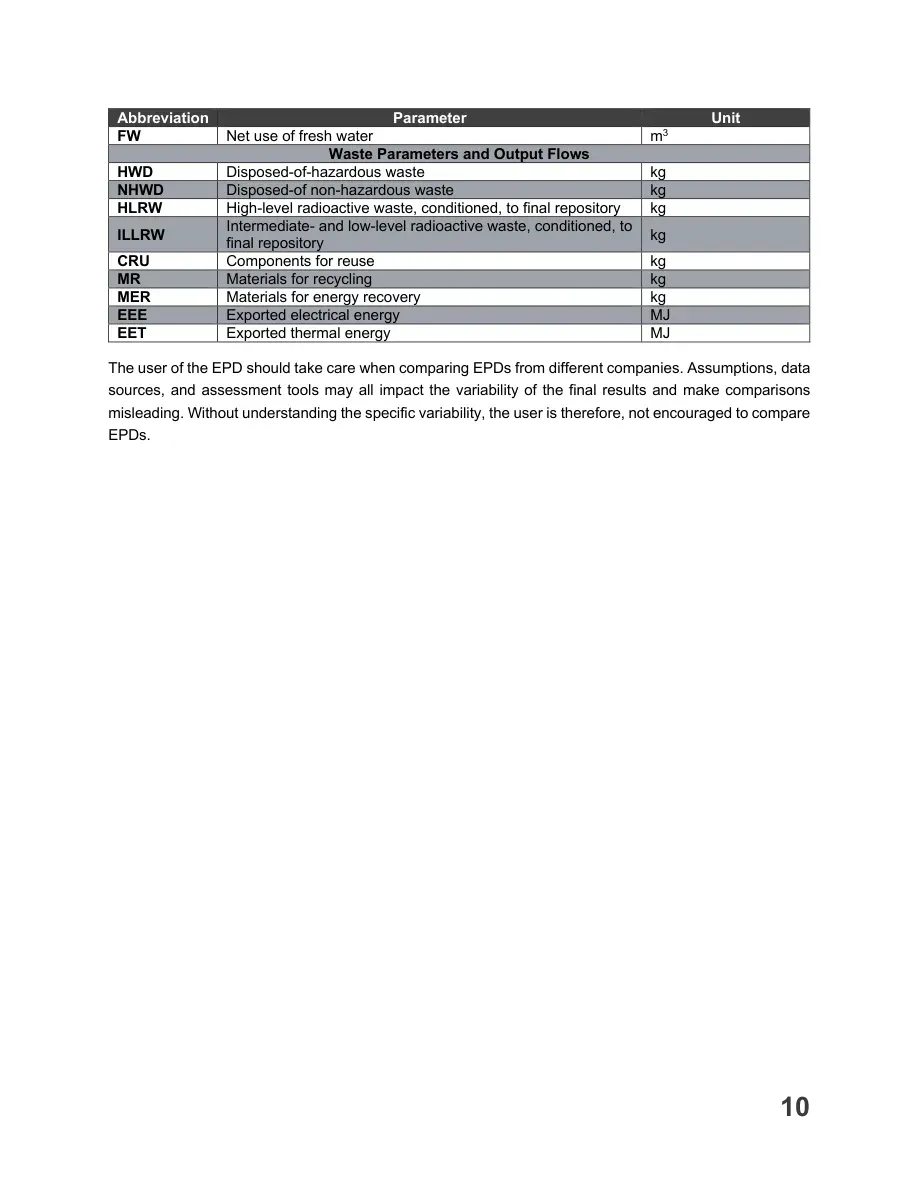
10 Abbreviation Parameter Unit FW Net use of fresh water m3 Waste Parameters and Output Flows HWD Disposed-of-hazardous waste kg NHWD Disposed-of non-hazardous waste kg HLRW High-level radioactive waste, conditioned, to final repository kg ILLRW Intermediate- and low-level radioactive waste, conditioned, to final repository kg CRU Components for reuse kg MR Materials for recycling kg MER Materials for energy recovery kg EEE Exported electrical energy MJ EET Exported thermal energy MJ The user of the EPD should take care when comparing EPDs from different companies. Assumptions, data sources, and assessment tools may all impact the variability of the final results and make comparisons misleading. Without understanding the specific variability, the user is therefore, not encouraged to compare EPDs.
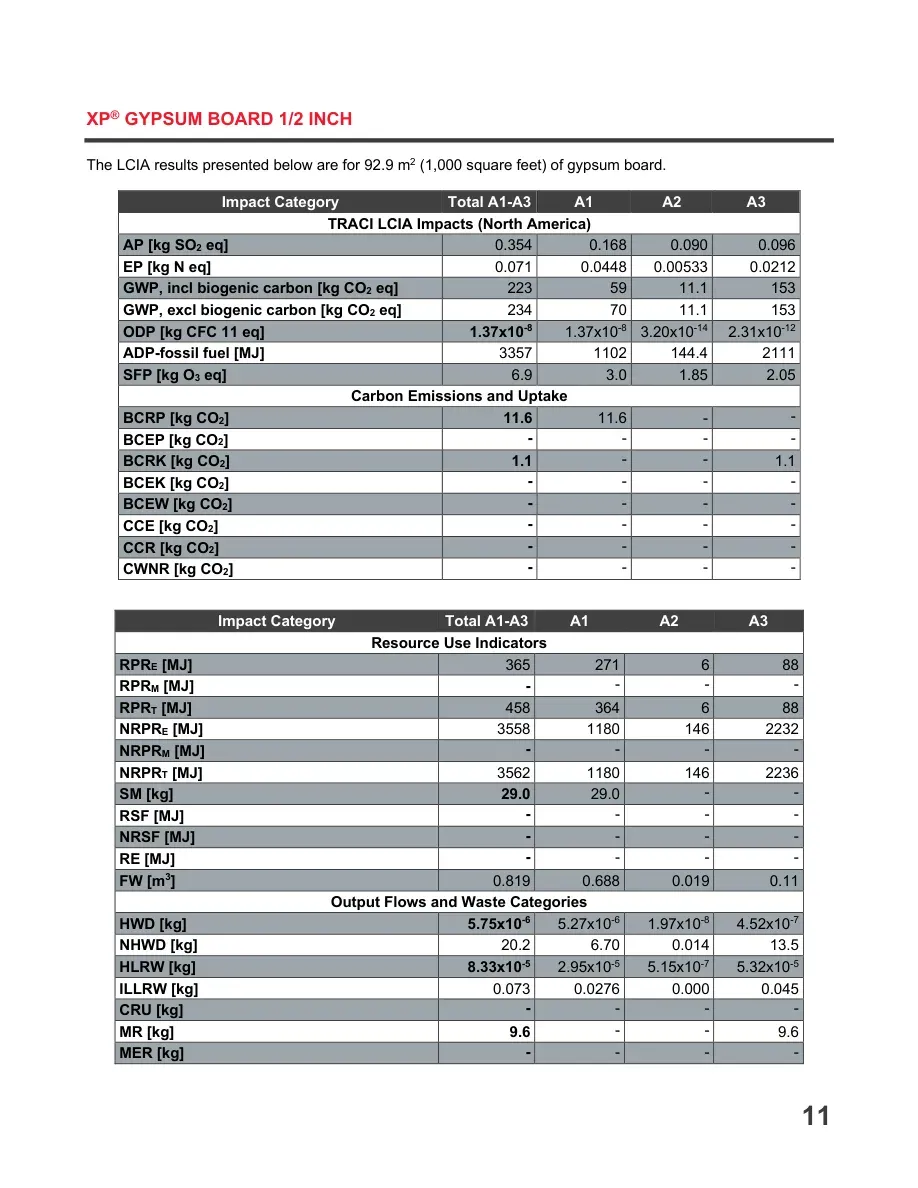
11 XP® GYPSUM BOARD 1/2 INCH The LCIA results presented below are for 92.9 m2 (1,000 square feet) of gypsum board. Impact Category Total A1-A3 A1 A2 A3 TRACI LCIA Impacts (North America) AP [kg SO2 eq] 0.354 0.168 0.090 0.096 EP [kg N eq] 0.071 0.0448 0.00533 0.0212 GWP, incl biogenic carbon [kg CO2 eq] 223 59 11.1 153 GWP, excl biogenic carbon [kg CO2 eq] 234 70 11.1 153 ODP [kg CFC 11 eq] 1.37x10⁻⁸ 1.37x10⁻⁸ 3.20x10⁻¹⁴ 2.31x10⁻¹² ADP-fossil fuel [MJ] 3357 1102 144.4 2111 SFP [kg O3 eq] 6.9 3.0 1.85 2.05 Carbon Emissions and Uptake BCRP [kg CO2] 11.6 11.6 - - BCEP [kg CO2] - - - - BCRK [kg CO2] 1.1 - - 1.1 BCEK [kg CO2] - - - - BCEW [kg CO2] - - - - CCE [kg CO2] - - - - CCR [kg CO2] - - - - CWNR [kg CO2] - - - - Impact Category Total A1-A3 A1 A2 A3 Resource Use Indicators RPRE [MJ] 365 271 6 88 RPRM [MJ] - - - - RPRT [MJ] 458 364 6 88 NRPRE [MJ] 3558 1180 146 2232 NRPRM [MJ] - - - - NRPRT [MJ] 3562 1180 146 2236 SM [kg] 29.0 29.0 - - RSF [MJ] - - - - NRSF [MJ] - - - - RE [MJ] - - - - FW [m3] 0.819 0.688 0.019 0.11 Output Flows and Waste Categories HWD [kg] 5.75x10⁻⁶ 5.27x10⁻⁶ 1.97x10⁻⁸ 4.52x10⁻⁷ NHWD [kg] 20.2 6.70 0.014 13.5 HLRW [kg] 8.33x10⁻⁵ 2.95x10⁻⁵ 5.15x10⁻⁷ 5.32x10⁻⁵ ILLRW [kg] 0.073 0.0276 0.000 0.045 CRU [kg] - - - - MR [kg] 9.6 - - 9.6 MER [kg] - - - -
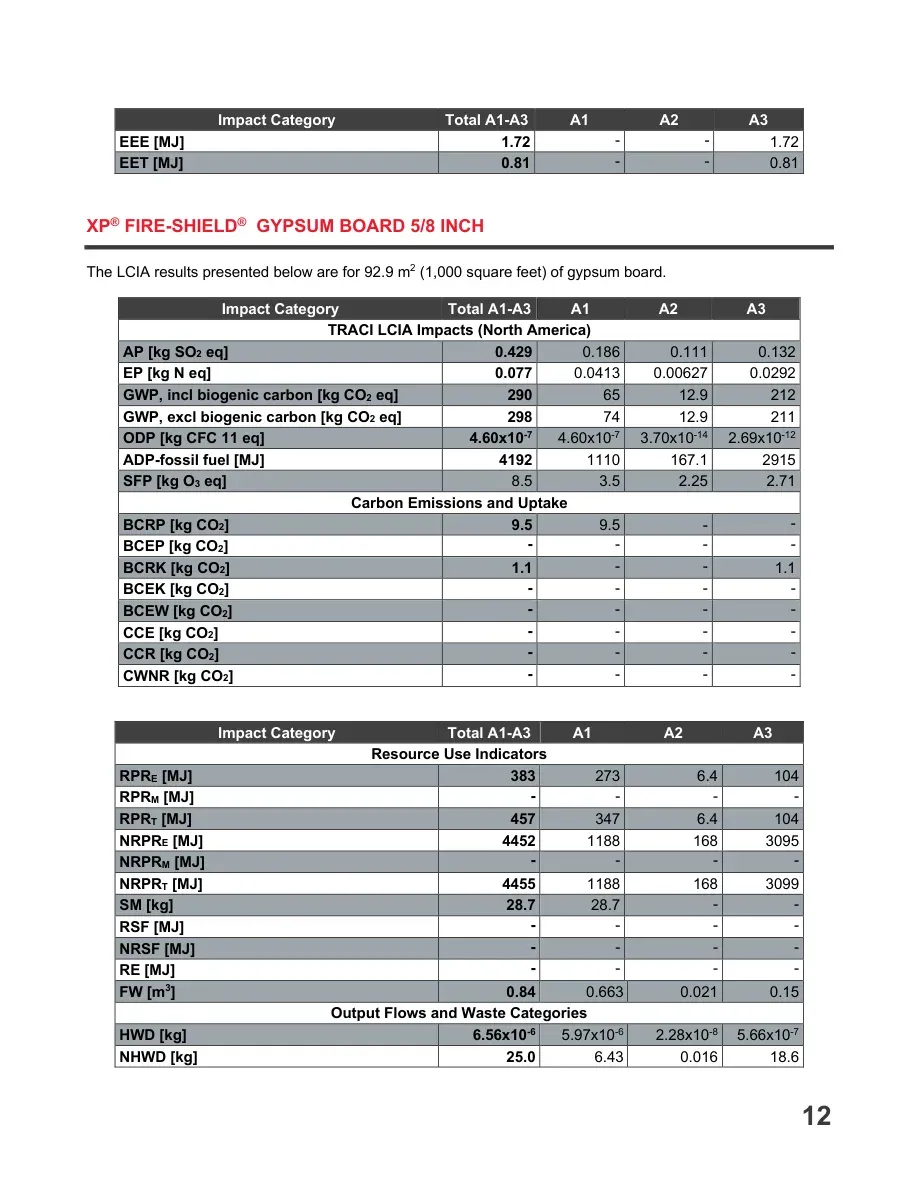
12 Impact Category Total A1-A3 A1 A2 A3 EEE [MJ] 1.72 - - 1.72 EET [MJ] 0.81 - - 0.81 XP® FIRE-SHIELD® GYPSUM BOARD 5/8 INCH The LCIA results presented below are for 92.9 m2 (1,000 square feet) of gypsum board. Impact Category Total A1-A3 A1 A2 A3 TRACI LCIA Impacts (North America) AP [kg SO2 eq] 0.429 0.186 0.111 0.132 EP [kg N eq] 0.077 0.0413 0.00627 0.0292 GWP, incl biogenic carbon [kg CO2 eq] 290 65 12.9 212 GWP, excl biogenic carbon [kg CO2 eq] 298 74 12.9 211 ODP [kg CFC 11 eq] 4.60x10⁻⁷ 4.60x10⁻⁷ 3.70x10⁻¹⁴ 2.69x10⁻¹² ADP-fossil fuel [MJ] 4192 1110 167.1 2915 SFP [kg O3 eq] 8.5 3.5 2.25 2.71 Carbon Emissions and Uptake BCRP [kg CO2] 9.5 9.5 - - BCEP [kg CO2] - - - - BCRK [kg CO2] 1.1 - - 1.1 BCEK [kg CO2] - - - - BCEW [kg CO2] - - - - CCE [kg CO2] - - - - CCR [kg CO2] - - - - CWNR [kg CO2] - - - - Impact Category Total A1-A3 A1 A2 A3 Resource Use Indicators RPRE [MJ] 383 273 6.4 104 RPRM [MJ] - - - - RPRT [MJ] 457 347 6.4 104 NRPRE [MJ] 4452 1188 168 3095 NRPRM [MJ] - - - - NRPRT [MJ] 4455 1188 168 3099 SM [kg] 28.7 28.7 - - RSF [MJ] - - - - NRSF [MJ] - - - - RE [MJ] - - - - FW [m3] 0.84 0.663 0.021 0.15 Output Flows and Waste Categories HWD [kg] 6.56x10⁻⁶ 5.97x10⁻⁶ 2.28x10⁻⁸ 5.66x10⁻⁷ NHWD [kg] 25.0 6.43 0.016 18.6
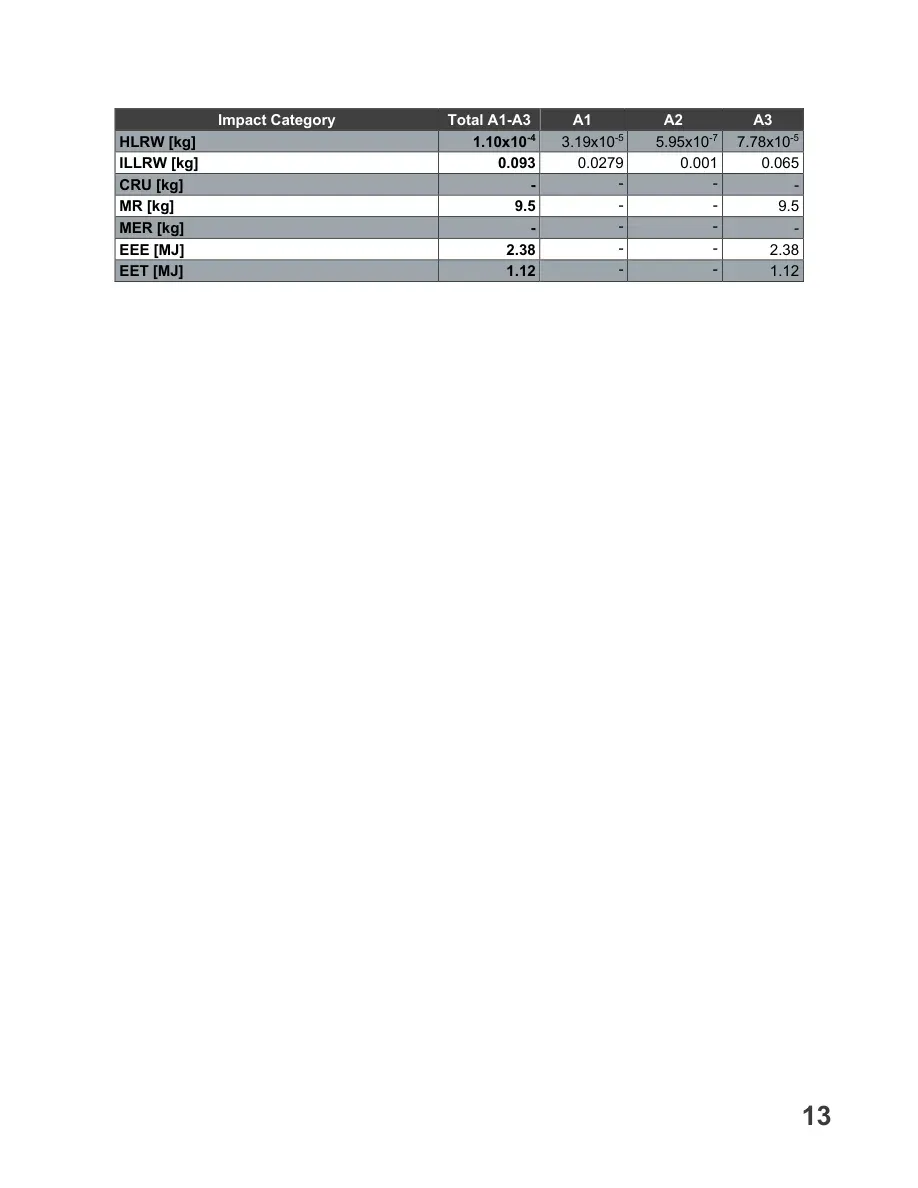
13 Impact Category Total A1-A3 A1 A2 A3 HLRW [kg] 1.10x10⁻⁴ 3.19x10⁻⁵ 5.95x10⁻⁷ 7.78x10⁻⁵ ILLRW [kg] 0.093 0.0279 0.001 0.065 CRU [kg] - - - - MR [kg] 9.5 - - 9.5 MER [kg] - - - - EEE [MJ] 2.38 - - 2.38 EET [MJ] 1.12 - - 1.12
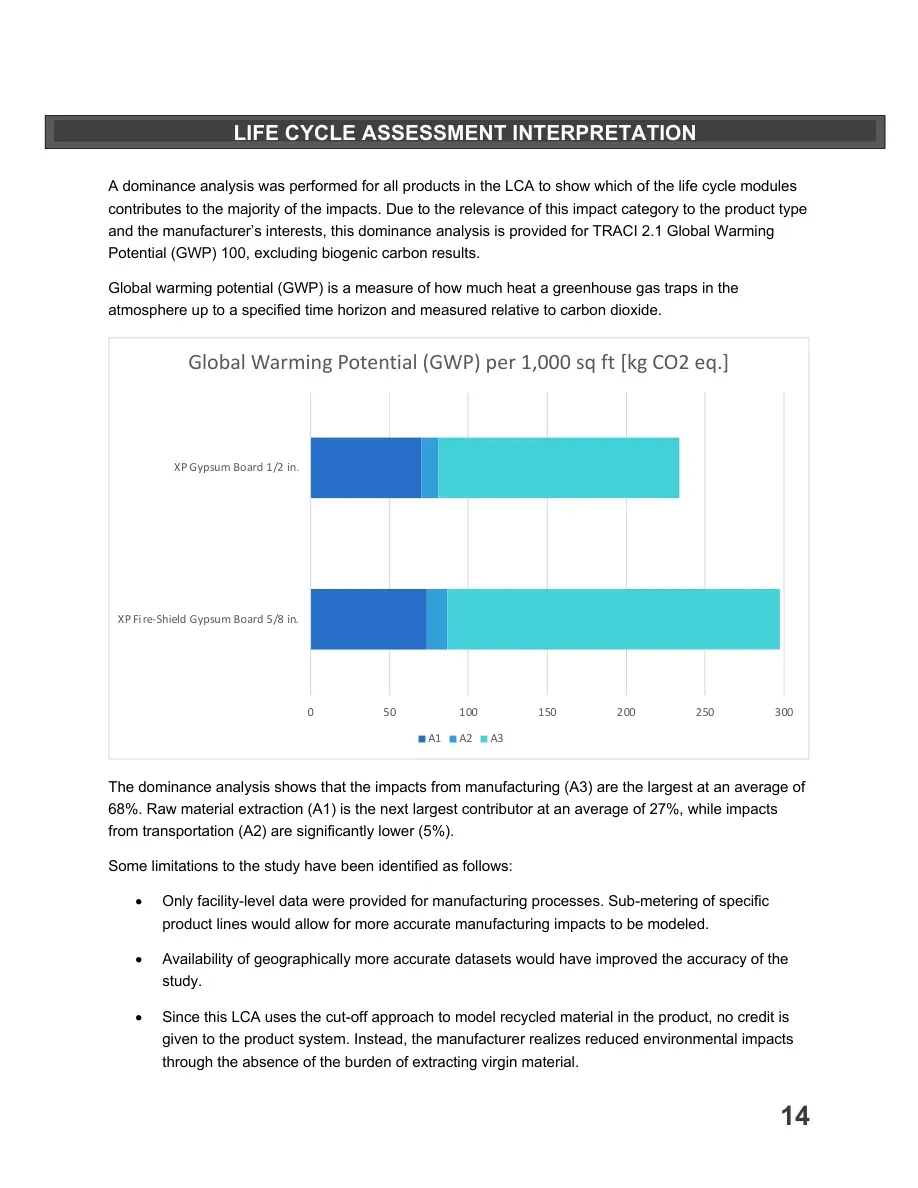
14 A dominance analysis was performed for all products in the LCA to show which of the life cycle modules contributes to the majority of the impacts. Due to the relevance of this impact category to the product type and the manufacturer’s interests, this dominance analysis is provided for TRACI 2.1 Global Warming Potential (GWP) 100, excluding biogenic carbon results. Global warming potential (GWP) is a measure of how much heat a greenhouse gas traps in the atmosphere up to a specified time horizon and measured relative to carbon dioxide. The dominance analysis shows that the impacts from manufacturing (A3) are the largest at an average of 68%. Raw material extraction (A1) is the next largest contributor at an average of 27%, while impacts from transportation (A2) are significantly lower (5%). Some limitations to the study have been identified as follows: • Only facility-level data were provided for manufacturing processes. Sub-metering of specific product lines would allow for more accurate manufacturing impacts to be modeled. • Availability of geographically more accurate datasets would have improved the accuracy of the study. • Since this LCA uses the cut-off approach to model recycled material in the product, no credit is given to the product system. Instead, the manufacturer realizes reduced environmental impacts through the absence of the burden of extracting virgin material. 050100150200250300XP Fire-Shield Gypsum Board 5/8 in.XP Gypsum Board 1/2 in.Global Warming Potential (GWP) per 1,000 sq ft [kg CO2 eq.]A1A2A3LIFE CYCLE ASSESSMENT INTERPRETATION
15 • Only known and quantifiable environmental impacts are considered. • Due to the assumptions and value choices listed above, these do not reflect real-life scenarios and hence they cannot assess actual and exact impacts, but only potential environmental impacts. ENVIRONMENTAL ACTIVITIES AND CERTIFICATIONS Gold Bond Building Products maintains certifications with UL and HPD Collaborative. XP Gypsum Board ½ inch and XP Fire-Shield Gypsum Board 5/8 inch are GREENGUARD Gold certified. Additionally, a Health Product Declaration (“HPD”) was created for XP Fire-Shield Gypsum Board 5/8 inch. Gypsum boards, if installed and treated properly, will last the lifetime of the building. ADDITIONAL ENVIRONMENTAL INFORMATION
16 1. Life Cycle Assessment, LCA Report for National Gypsum – Gypsum Boards. WAP Sustainability Consulting. September 2022. 2. NSF Product Category Rule (PCR) for Gypsum Panel Products Version 1.1 (April 2020) 3. ISO 14044: 2006 Environmental Management – Life cycle assessment – Requirements and Guidelines. 4. ISO 14044: 2006/ Amd 1:2017 Environmental Management – Life cycle assessment – Requirements and Guidelines – Amendment 1. 5. ISO 14025:2006 Environmental labels and declarations – Type III environmental declarations – Principles and Procedures. 6. ISO 21930:2017 Sustainability in buildings and civil engineering works – Core rules for environmental product declarations of construction products and services. REFERENCES